Hi Blynk team,
what do you think about adding concentric gauges widget, something like this :
https://powerviz.ai/activity-gauge
thank you
Bruno
Hi Blynk team,
what do you think about adding concentric gauges widget, something like this :
https://powerviz.ai/activity-gauge
thank you
Bruno
Thanks for the idea.
What would you plot on a chart like this?
for example when you have same devices sharing properties like indoor + outdoor temperature, cpu load 1/5/15 minutes, … you can have an overview of your device fleet at a glance
Got it, thanks. Soon we will be releasing a feature to create fleet-wide dashboards. It might not have this gauge, but you’ll be able to compare values across multiple devices in the same view.
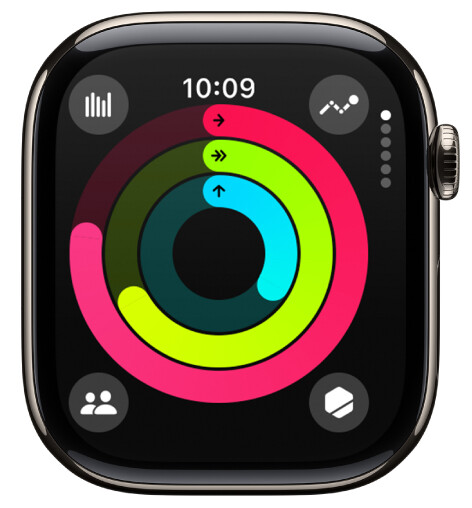
The Activity app on the Apple Watch uses a similar style of gauge…
The idea is to close each ring, to indicate that you’ve met your exercise targets for the day. For some reason mine never seem to get beyond the 3 o’clock position, I think my watch must be faulty ![]()
While it’s a good representation of multiple variables in one gauge, I suspect that the challenge would be to add a legend that explains what each one means.
Pete.
I suspect that the challenge would be to add a legend that explains what each one means.
I suppose the datastream labels could be represented the same way as in the chart widget, or with colored icons in the corners. a central icon or value attached to a datastream would be a plus.
That works fine for the SuperChart because of its size, but can’t see it working well with a smaller widget.
Pete.