Blynk superchart is snapping instead of scrolling at first use

Hey,

there might be a discussion already here somewhere, but I could not find it.

I have 2 issues with the superchart.

#1:
Whenever I scroll through the data on the superchart, it does not scroll smoothly at the first use.
Instead it “snaps”/jumps far to the left…
After that, scrolling is smooth and perfect as is should be.

Here is a video for demonstration:

Can this be avoided?

#2:
In the week view of the supercharts, there are some days missing
Check here the portrait view of “Tägliche Regenmenge”:


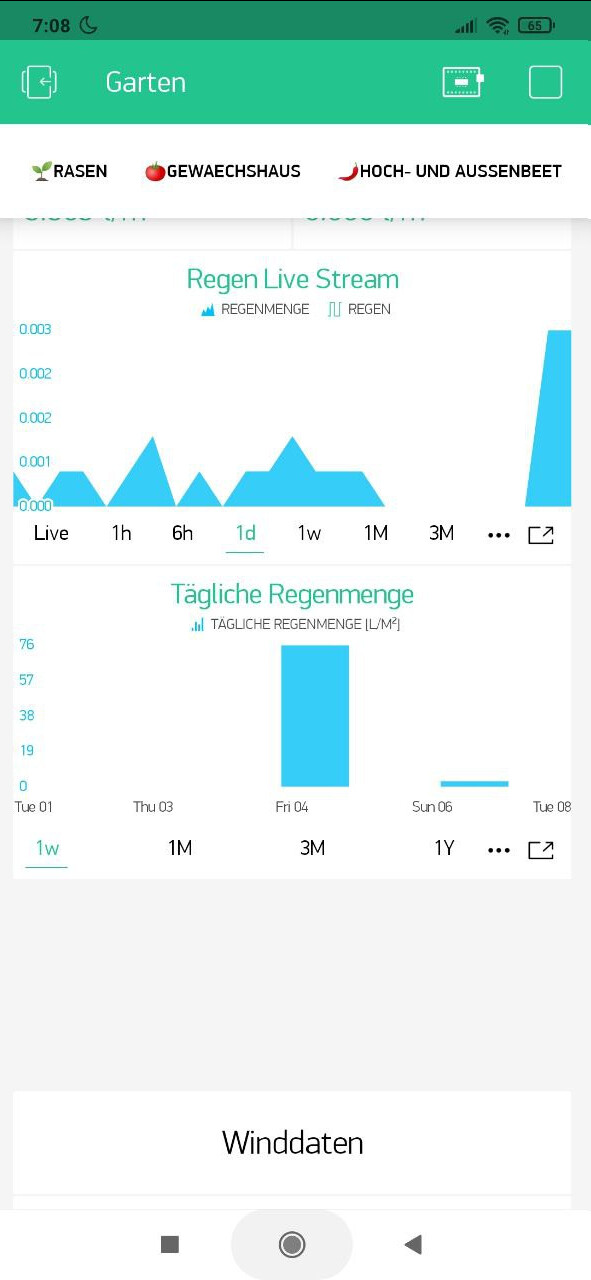
There are 5 days listed (tuesday, thursday, friday, sunday, tuesday).
These are not equal to the bar charts that are beeing shown - they are shifted.
Also some its weird that this is shown:
tuesday [yes], wednesday [no], thursday [yes], friday [yes], saturday [no], sunday [yes], monday [no], thursday [yes].

I dont see any pattern, why some days are missing.

Now in landscape mode, there is also one day missing: the sunday.
Looks like blynk is also taking a day off like god :smiley:

So what is the reason for this, what is going on here and how can I prevent this?

Thanks a lot! :slight_smile:

You should probably think about upgrading to the new version of Blynk, as the version you are using won’t be developed any further, and will be retired at some point (maybe as early as 6 months from now).

Pete.

Yeah I know that, but Blynk 2.0 is sadly no option for me.

I would gladly pay for each device but the current pricing and the included functions for that is bad for my use case.

Even if there is no “old Blynk” I can not affort USD 60 per year for a weather station.
The “pro plan” would be needed for the supercharts with multiple data streams.
And this only stores the data for 3 month - so I am not even able to observe one season :frowning:
Additionally the interessting data for me is only about 7-9 month of the year and I will have to pay ~November-March (winter) without the need to have the weather station in the garden during the winter.

So a “pro” plan would be necessary for me and USD 468 / year is out of question.

So either blynk 1.x works or I must find a different solution.

I really love blynk but for small budget hobbyists and students the new version is not really attractive :frowning:

A good solution for me would be to pay for a the Blynk 1.0 app each time a new major OS version is released which causes the current one to now work anymore.

But back to topic:
Is this the “normal” behaviour or can this somehow be avoided?

I guess it might be a bug, but if it is then it wont get fixed in the old version. Or, it might be how you have configured your chart.

That won’t happen!

You could look at using Node-Red, and storing the data in a database on your Node-Red server, then you have it fully under your control.
I use MQTT to send data from my weather station into Node-Red, but I currently store that data on Blynk. I’ll be migrating that data to my own database at some point.

Pete.