Hi…
I have a problem when I connect the Blynk with node- red…
the blynk is connected but have no result…
can anyone help me?
Your url should be blynk.cloud
Are you using Blynk Legacy or Blynk IoT?
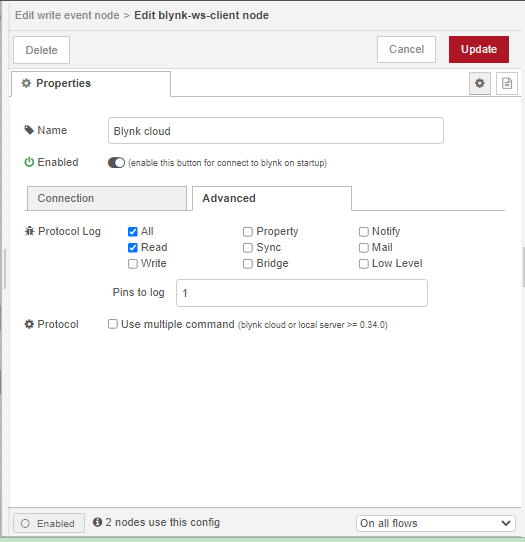
If you’re using Blynk IoT then you should also be using the node-red-contrib-blynk-iot contrib, not the node-red-contrib-blynk-ws contrib that is shown in your screenshots.
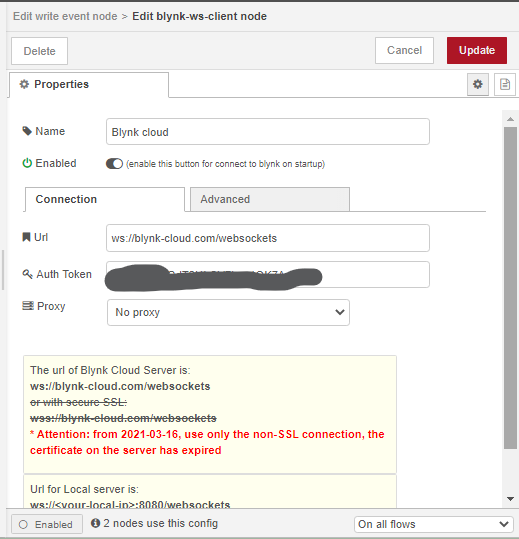
Blynk IoT uses blynk.cloud and your IoT template ID in the configuration node, and Blynk Legacy uses ws://blynk-cloud.com/websockets
Once you have that sorted-out correctly (assuming that it isn’t already) then do you have a widget in the app that is connected to pin D1, which you are changing to generate new values in Node-Red?
Pete.
2 Likes
I am using Blynk Legacy, and I connected to pin D1 and i get a values in my mobile app(on blynk).
what is the different between Blynk Legacy or Blynk IoT?
and how can I get template ID?
I get this error:
Connection redirecting to: ws://188.166.206.43:80/websockets
Okay, in that case it wasn’t a good idea to add the “blynk20” tag to your topic, this is used to indicate that you are using the latest version of Blynk (Blynk IoT) not Legacy.
I’ve fixed this for you.
Those are both irrelevant questions at this point if you are using Legacy.
I’m not sure what this means. The Node-Red flow that you’ve shared with us has no nodes that write data to the Blynk server (and therefore the app), only that receive data from the Blynk server (on Pin V1).
You need to clarify exactly what you are doing and what your problem is.
Okay, that’s the first time you’ve mentioned this. Has it just occurred, and is it as a result of a change that you’ve made?
Is this actually an error, or an information message?
Does it appear in the debug pane of Node-Red when you deploy your flow, or is it in the console window?
The more information that you can provide, such as what operating system you are running Node-Red on, what version of the app you are using etc makes it much easier for us to help you.
Pete.
I’m trying to view results coming from blynk on dashboard…
Yes, I gathered that from your flow and screenshot. But, you’ve not given us much other info to help you resolve whatever issue(s) it is that you are having.
Try answering some of the questions I’ve asked so far.
Also, does changing the widget attached to pin V1 in your app produce any output in the debug pane from the msg node (which appears to be turned-off in your screenshot)?
Pete.
I really don’t know what the problem is.
When I click on the deploy icon it gives this error
(Websocket Error: socket hang up), Although I haven’t changed anything…
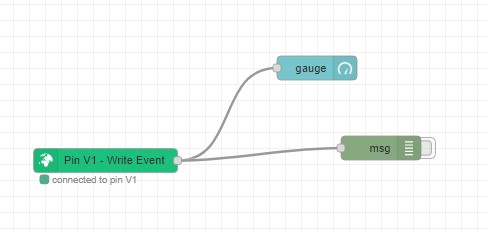
As shown in the image above  , there is a connection between node and blynk, but the results are not displayed on the dashboard.
That’s the first time you’ve mentioned that error!
But I’ve asked you previously where the “Connection redirecting to: ws://188.166.206.43:80/websockets” message displays and whether it is actually an error, but you haven’t answered that question.
And I’ve asked you to ensure that the msg node is turned on. and for you to tell is what displayed in the debut pane, but you’ve ignored that question too.
I’m a great advocate of Node-Red, and always happy to help people get started with using Blynk in Node-Red, but I’m fairly quickly going to walk away from this topic if you aren’t able to provide more information and answer questions when they are asked.
Pete.
I’m sorry for I couldn’t explain my problem; Because I am a beginner to use Node-red.
But I’ll show you what I did and tell me if it’s true or not…
Firstly
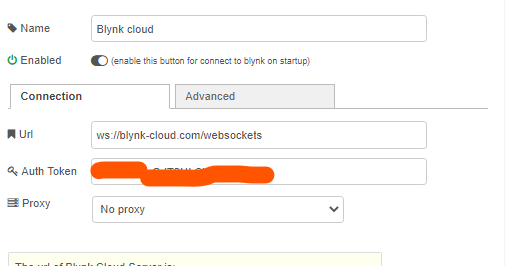
I linked Node- red with blynk and wrote token and URL in Node, as shown in the picture…
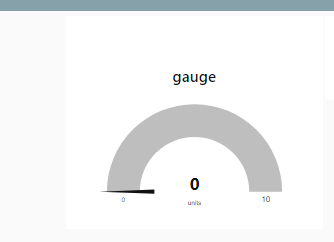
Next, I connected the node with gauge.
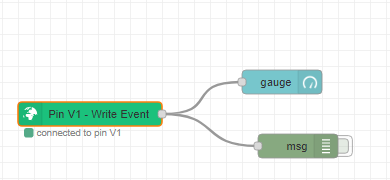
And also connected with msg.
And when I press deploy, this message appears in debug messages .
“Connection redirecting to: ws://188.166.206.43:80/websockets”
Okay, I’ll try a little more before I give up.
Take a look at these two message nodes:
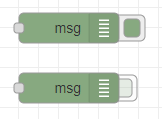
The top one is enabled (button on the right is dark green and sticks out)
The bottom one is disabled (Button on the right is light green and only sticks out half way)
Compare this to your msg node and you’ll see that yours is turned OFF (Disabled) so it does nothing:
Click the button on the right to turn it ON.
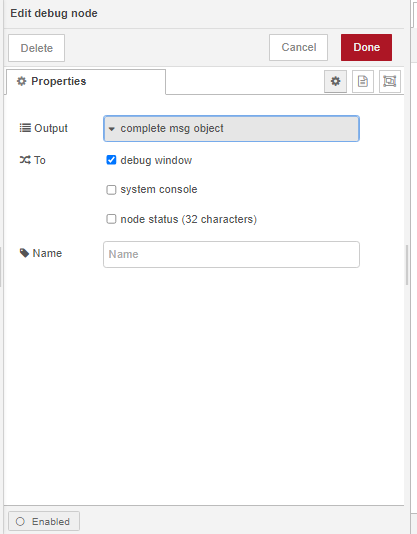
You then need to look at the the Debug pane to see the output from that msg node:
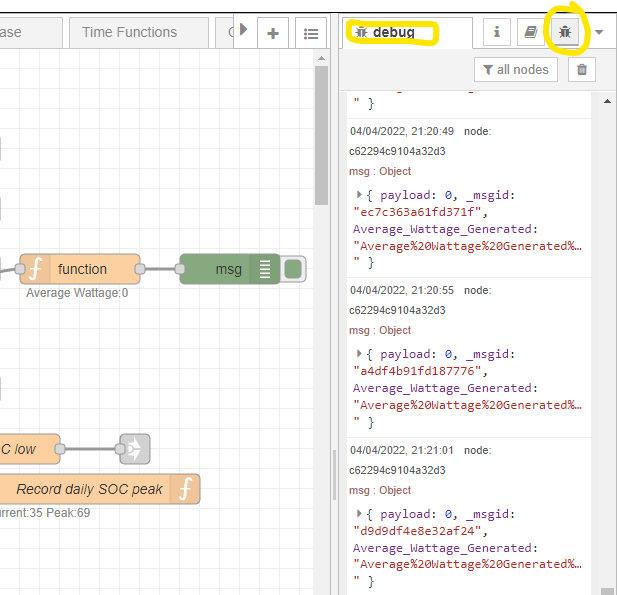
I keep asking where you see these messages, and if they are errors or information.
As you don’t seem to be able to answer this, I’d suggest that you take a screenshot each time you see one of these messages, and post it, along with details of what you did (full deploy etc) immediately before the message appeared.
Pete.