Hi
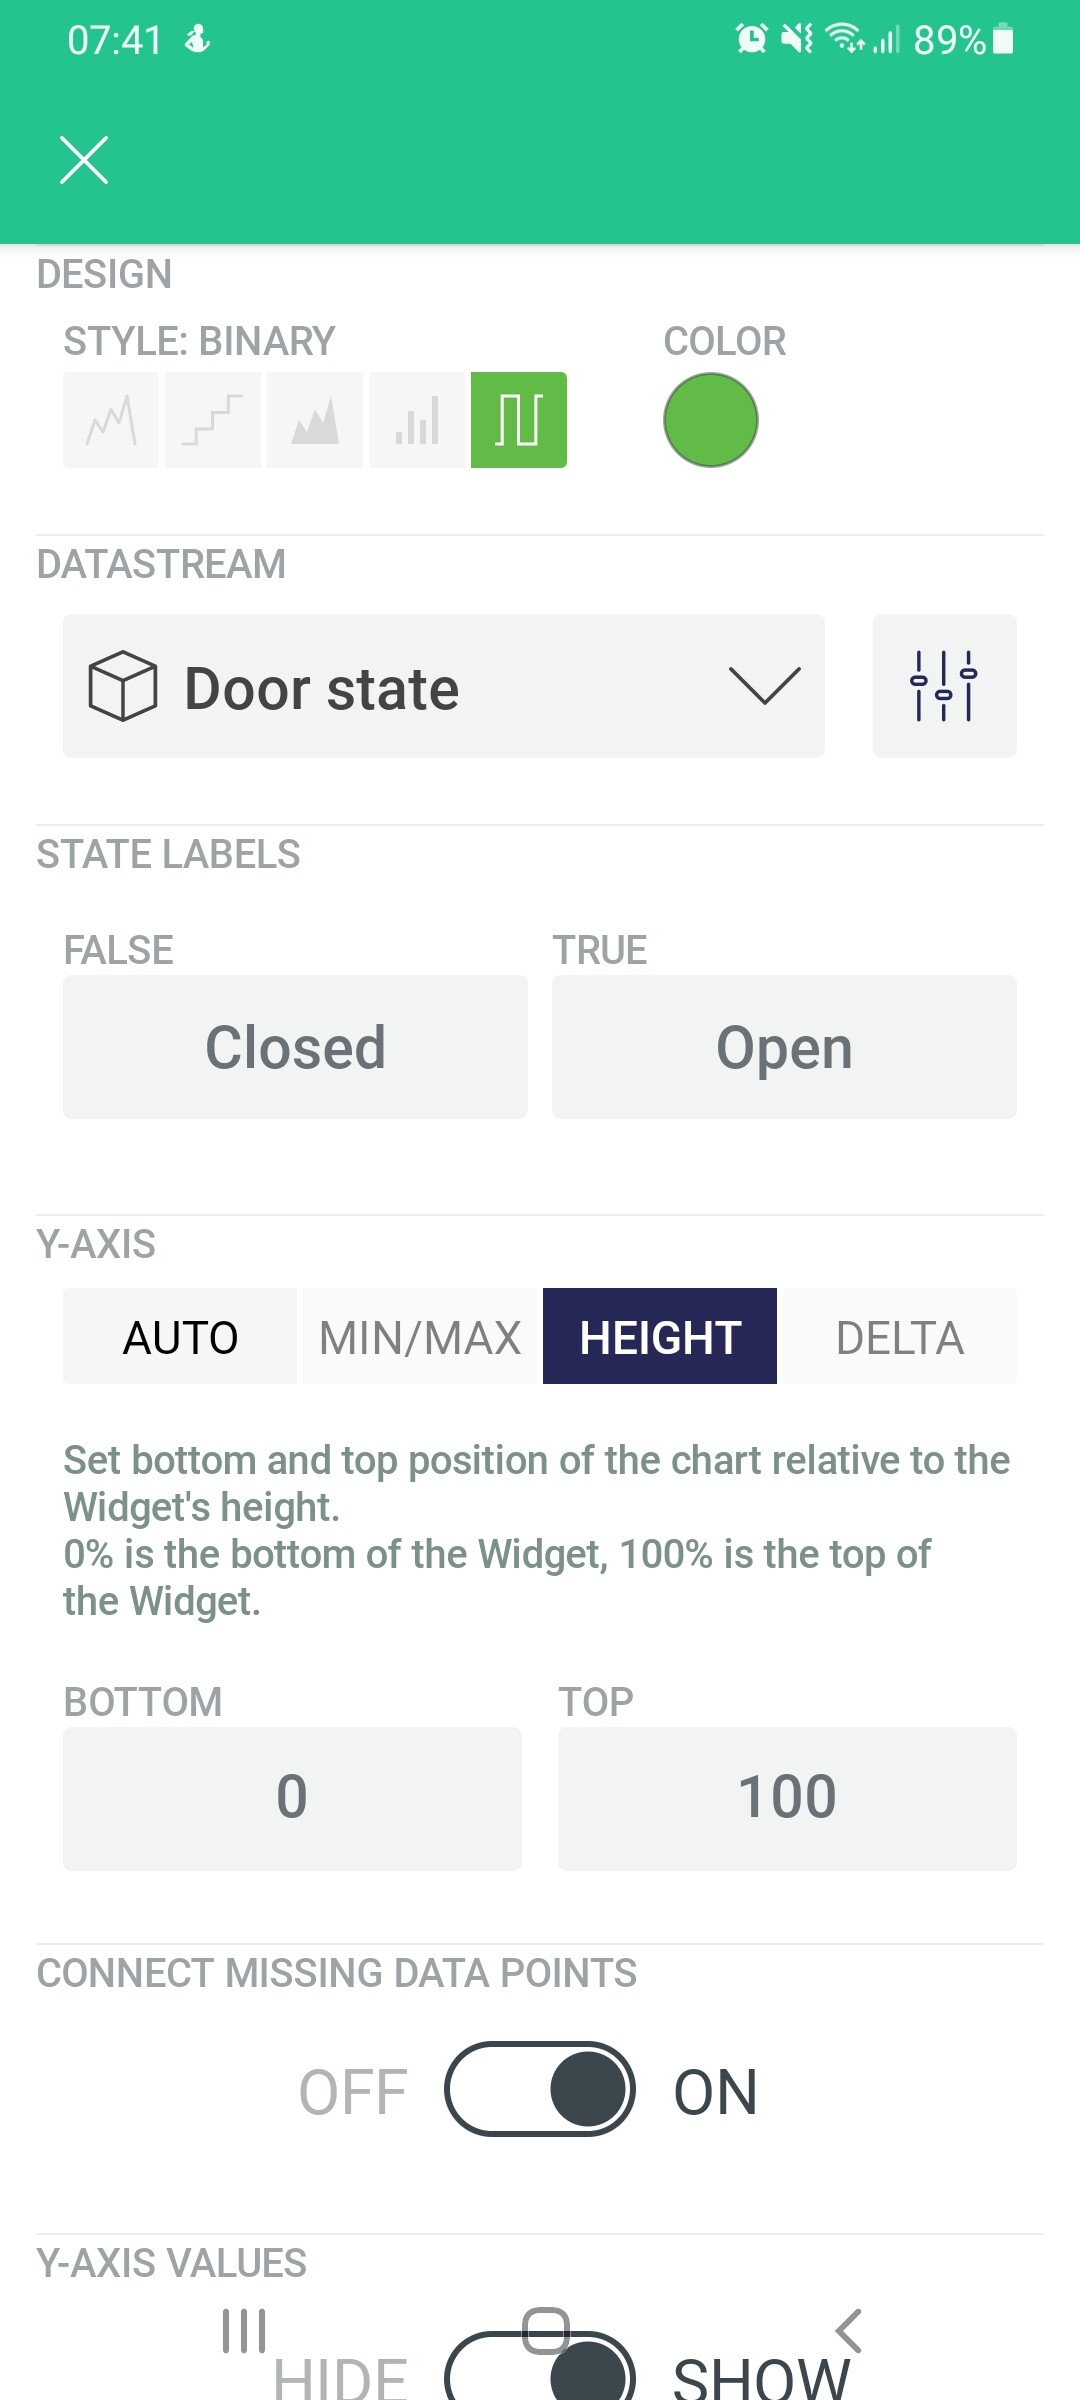
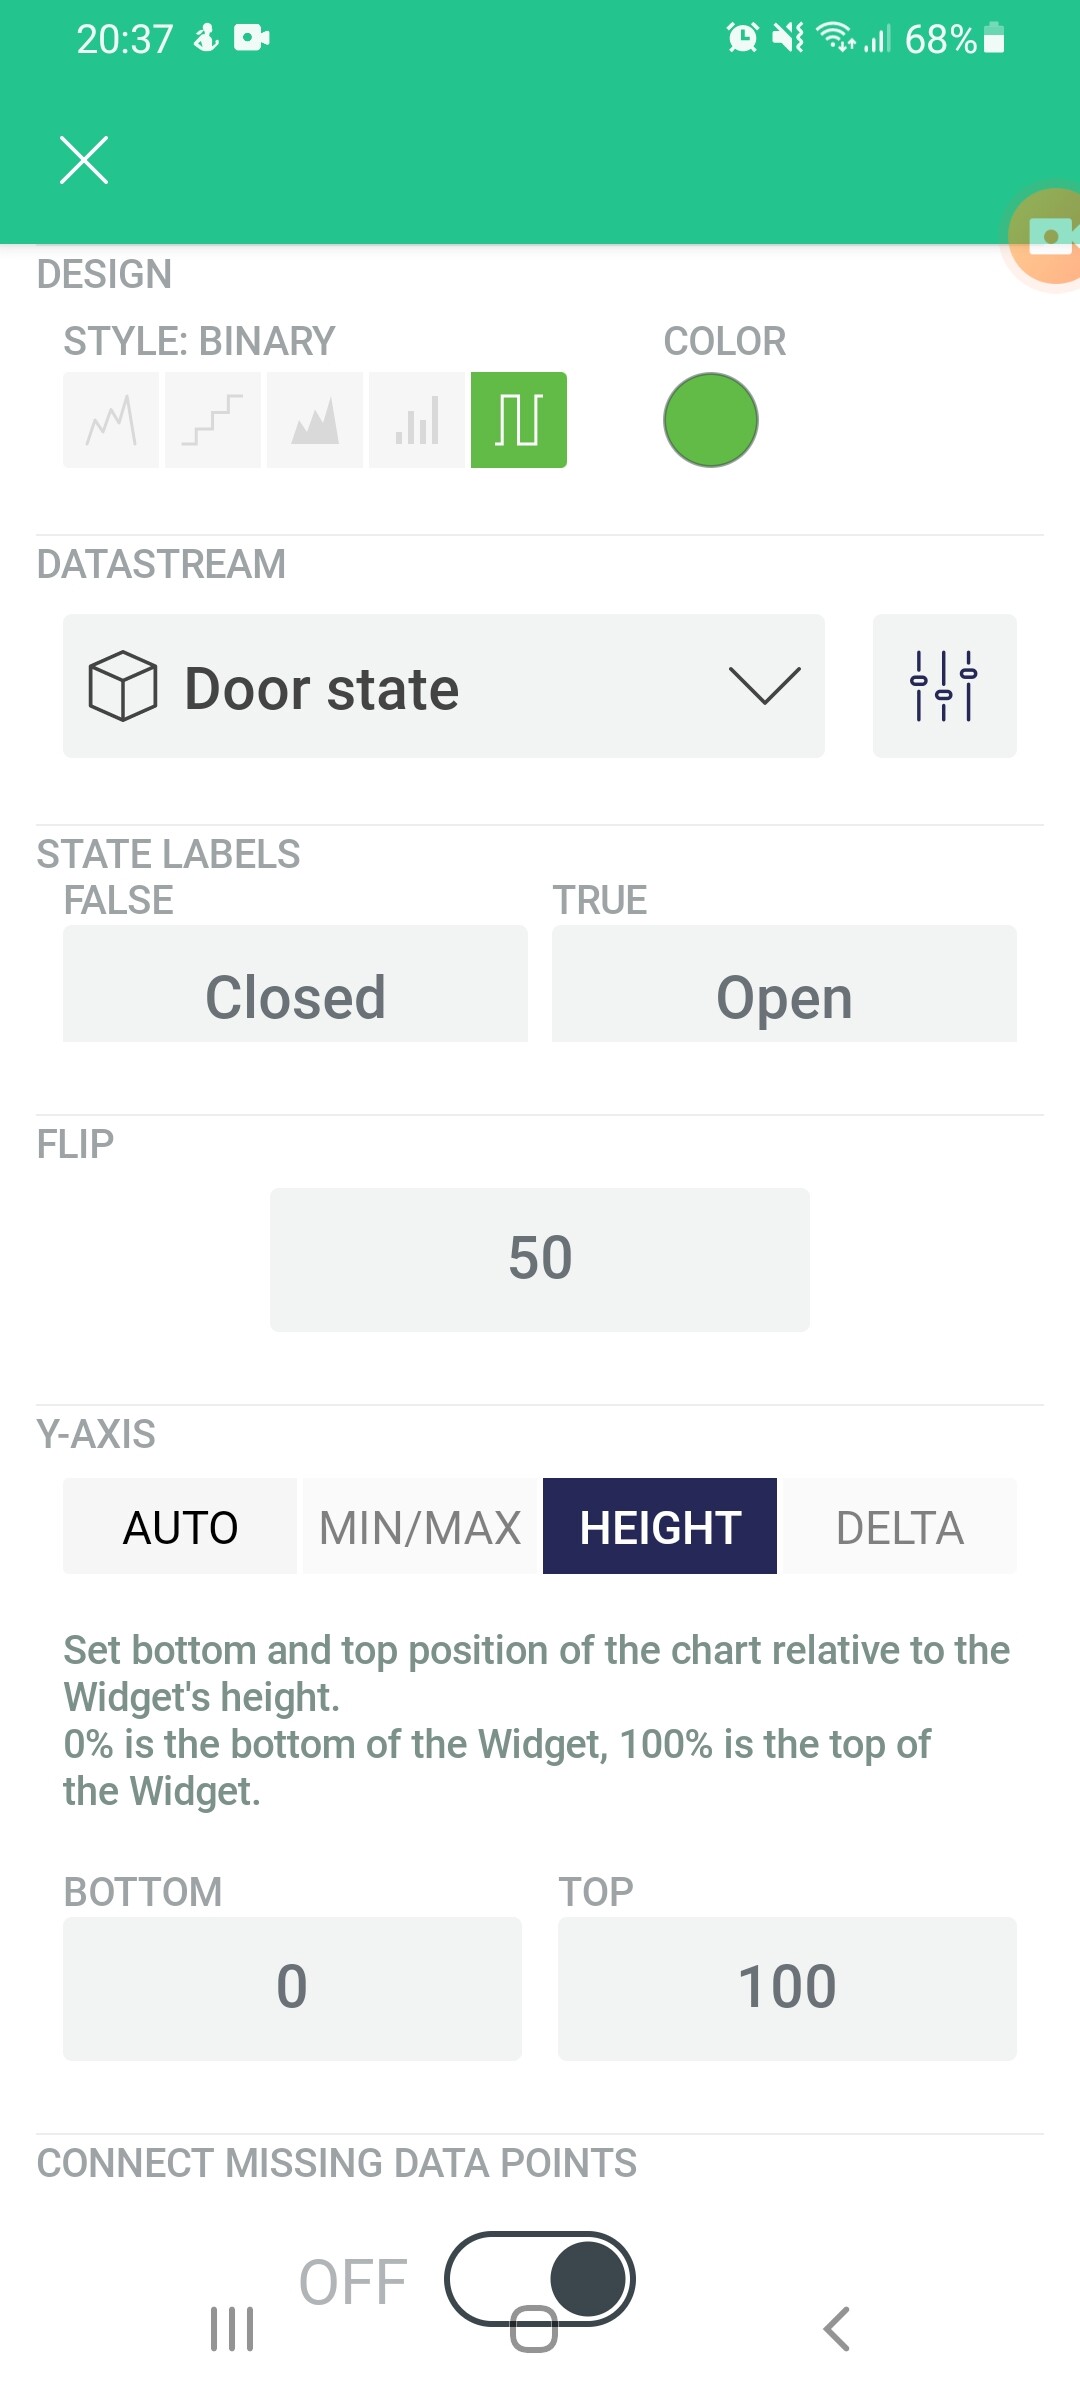
I’ve been using Superchart in the legacy version of Blynk and had no problems with it, but having migrated the code to Superchart 2.0, I have a problem with the binary data option. The legacy version has a Flip value but the new version does not have this field - see attached screen shot. The Help icon in the superchart mentions this should be there, so has it been moved to somewhere else, or is it missing?
Hi @BlynkAndroidDev, also may I please bring to your attention another possible bug on superchart. When for example two data streams are charted and you want split the graph into segments using the ‘height’ option say for example 0 to 50 percent for one datastream and 51 to 100 percent for the other datastream I would expect the data streams to be separated above and below each other… It doesn’t seem to do this.
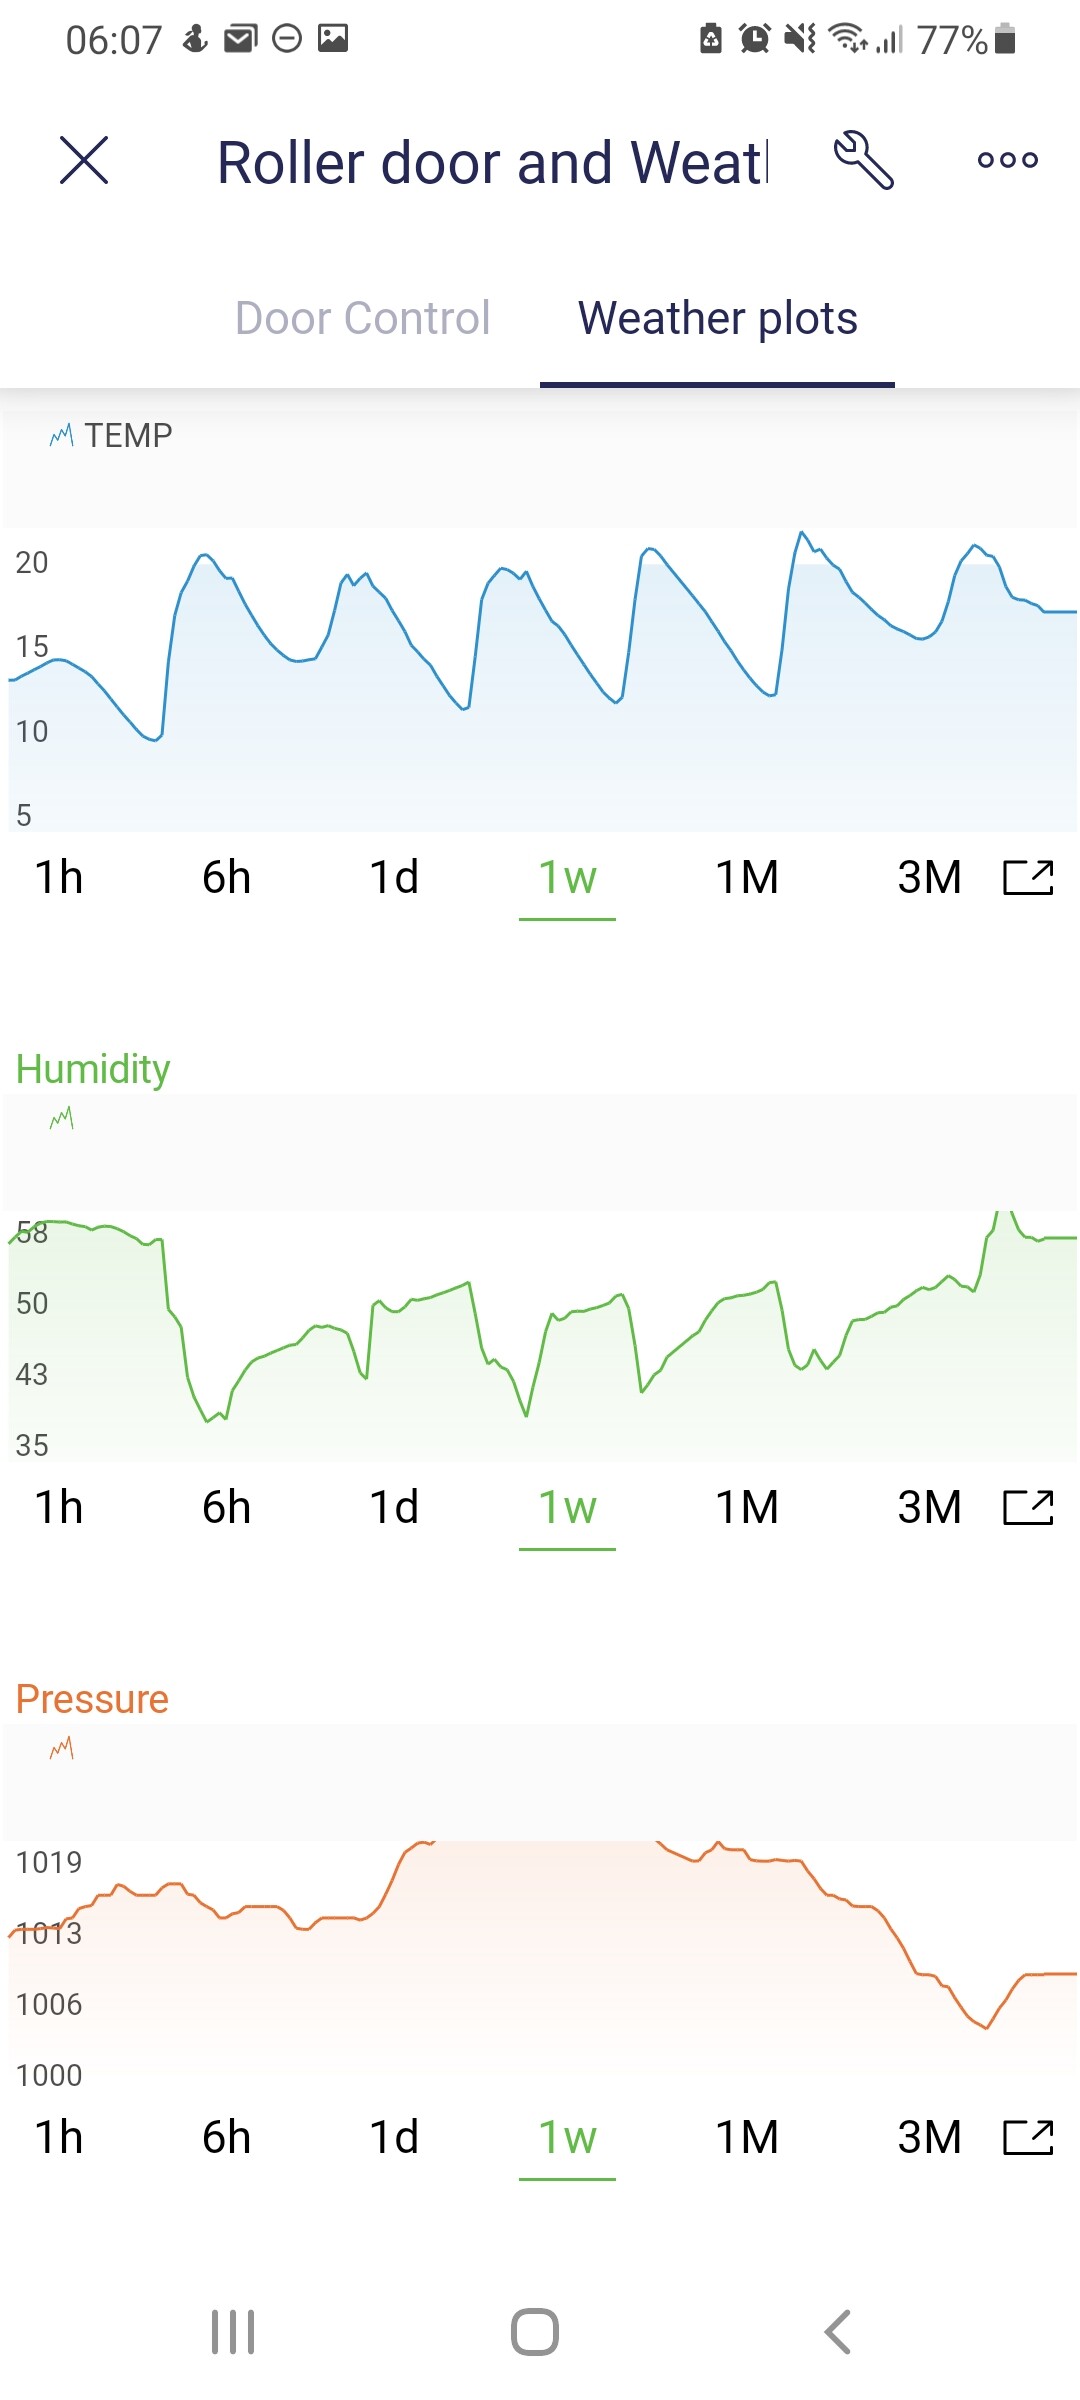
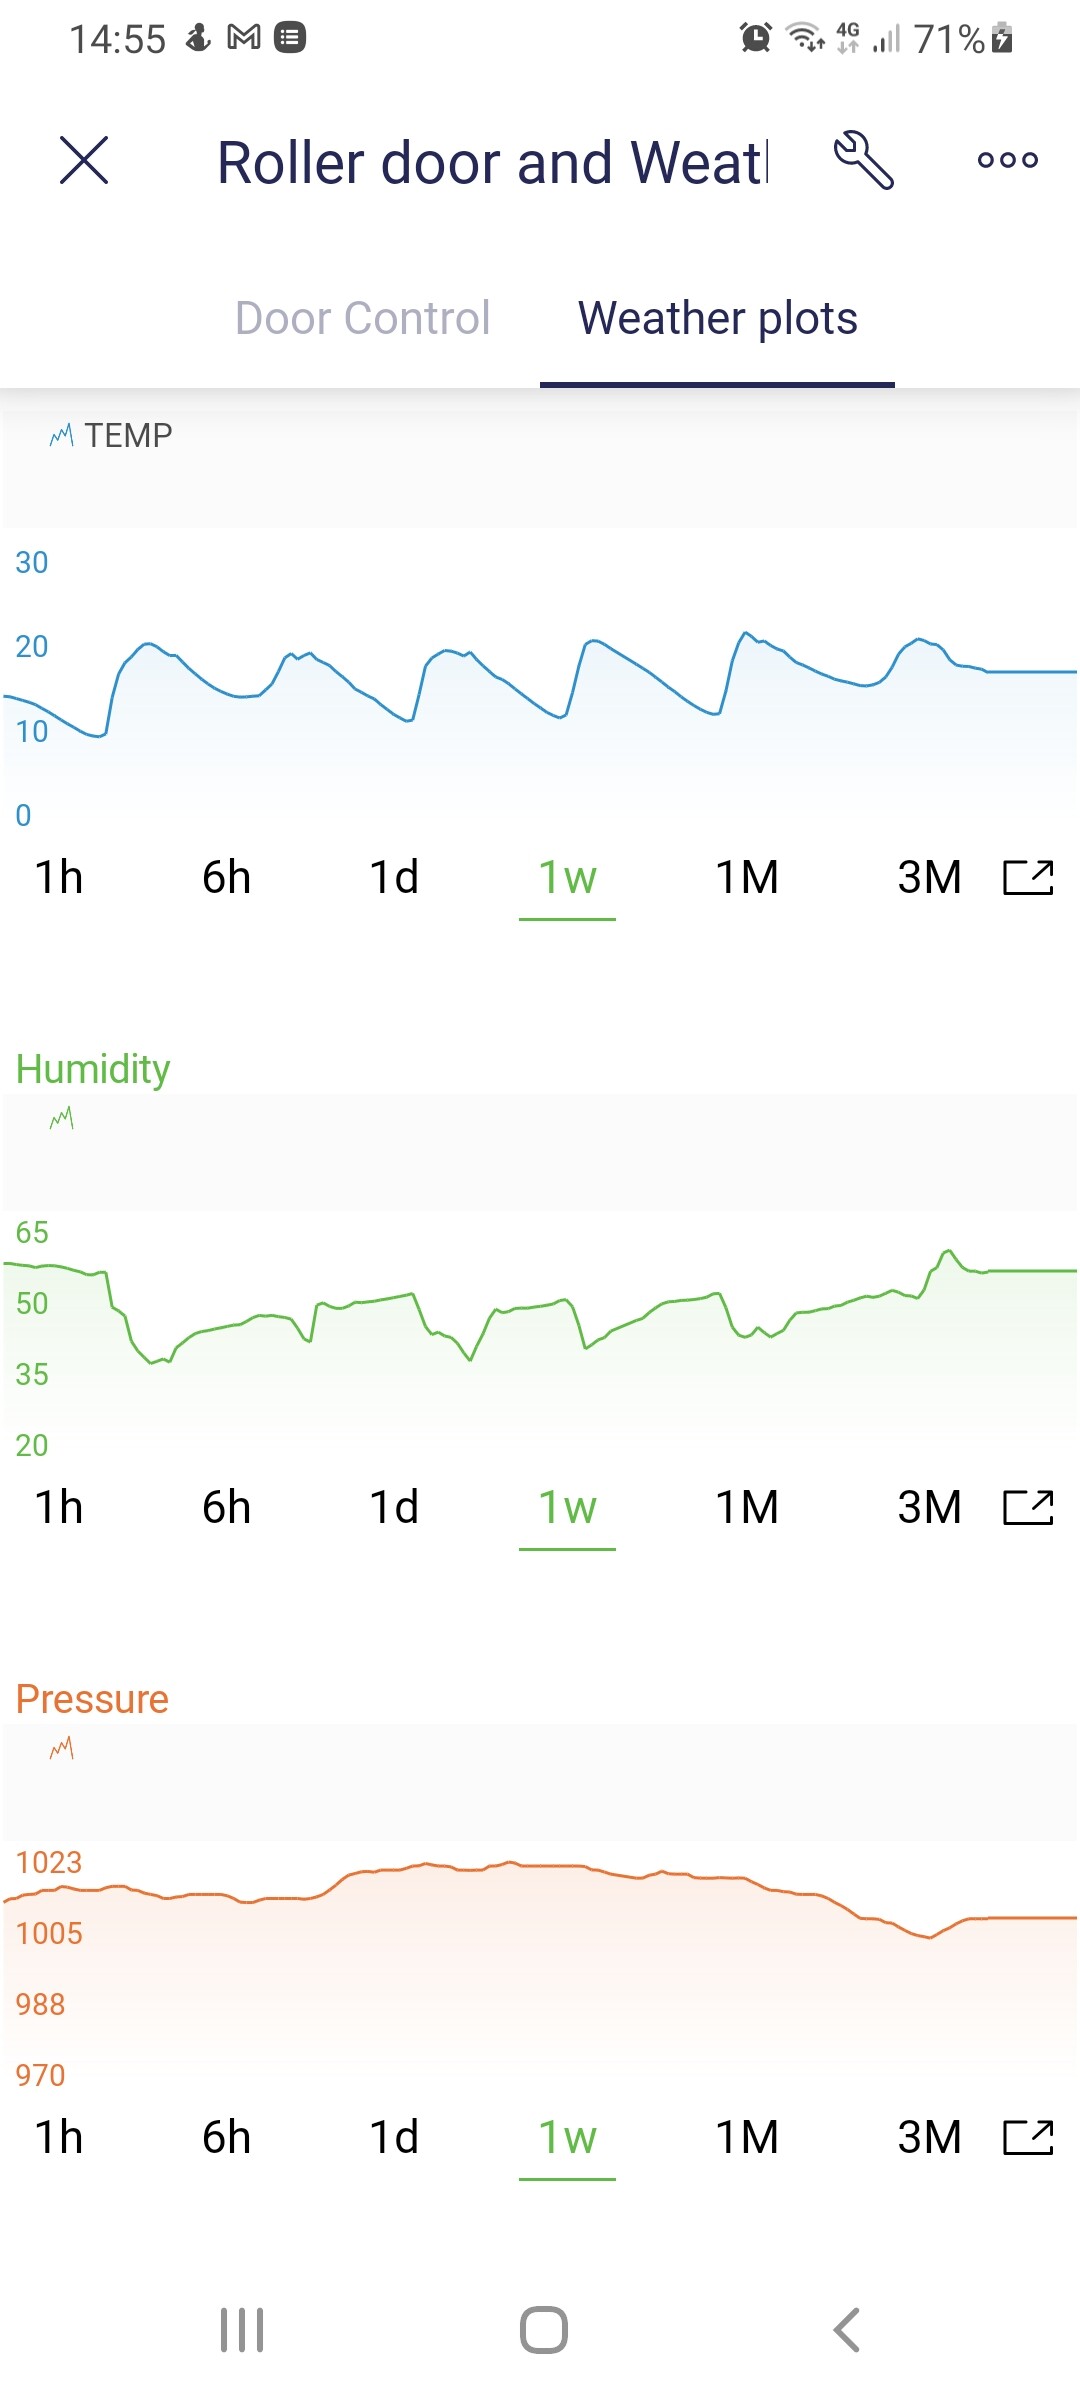
The plots do not show the full range of the Max/Min values selected (This was perfect in Blynk Legacy)
When set to Auto, the plot overshoots the top of the display, and it is only visible after long-pressing the plot. (See pressure plot in the second screenshot)
Ahh yes, so I have. After unsetting that switch, I’m back to an earlier issue where the Max value I set for the range is hidden by the banner bar. In the attached screen shot, the Max Temp is 40, Max Humidity is 80 and Max Pressure is 1040, but non of these values are visible in the plots. In Superchart Legacy, they were all visible. Is there another setting that I’m using incorrectly?
Yep, this is definitely an UI bug, I’m investigating it right now. As I understand, it is values overlay which shows after long press on the chart, and hides after tap up.
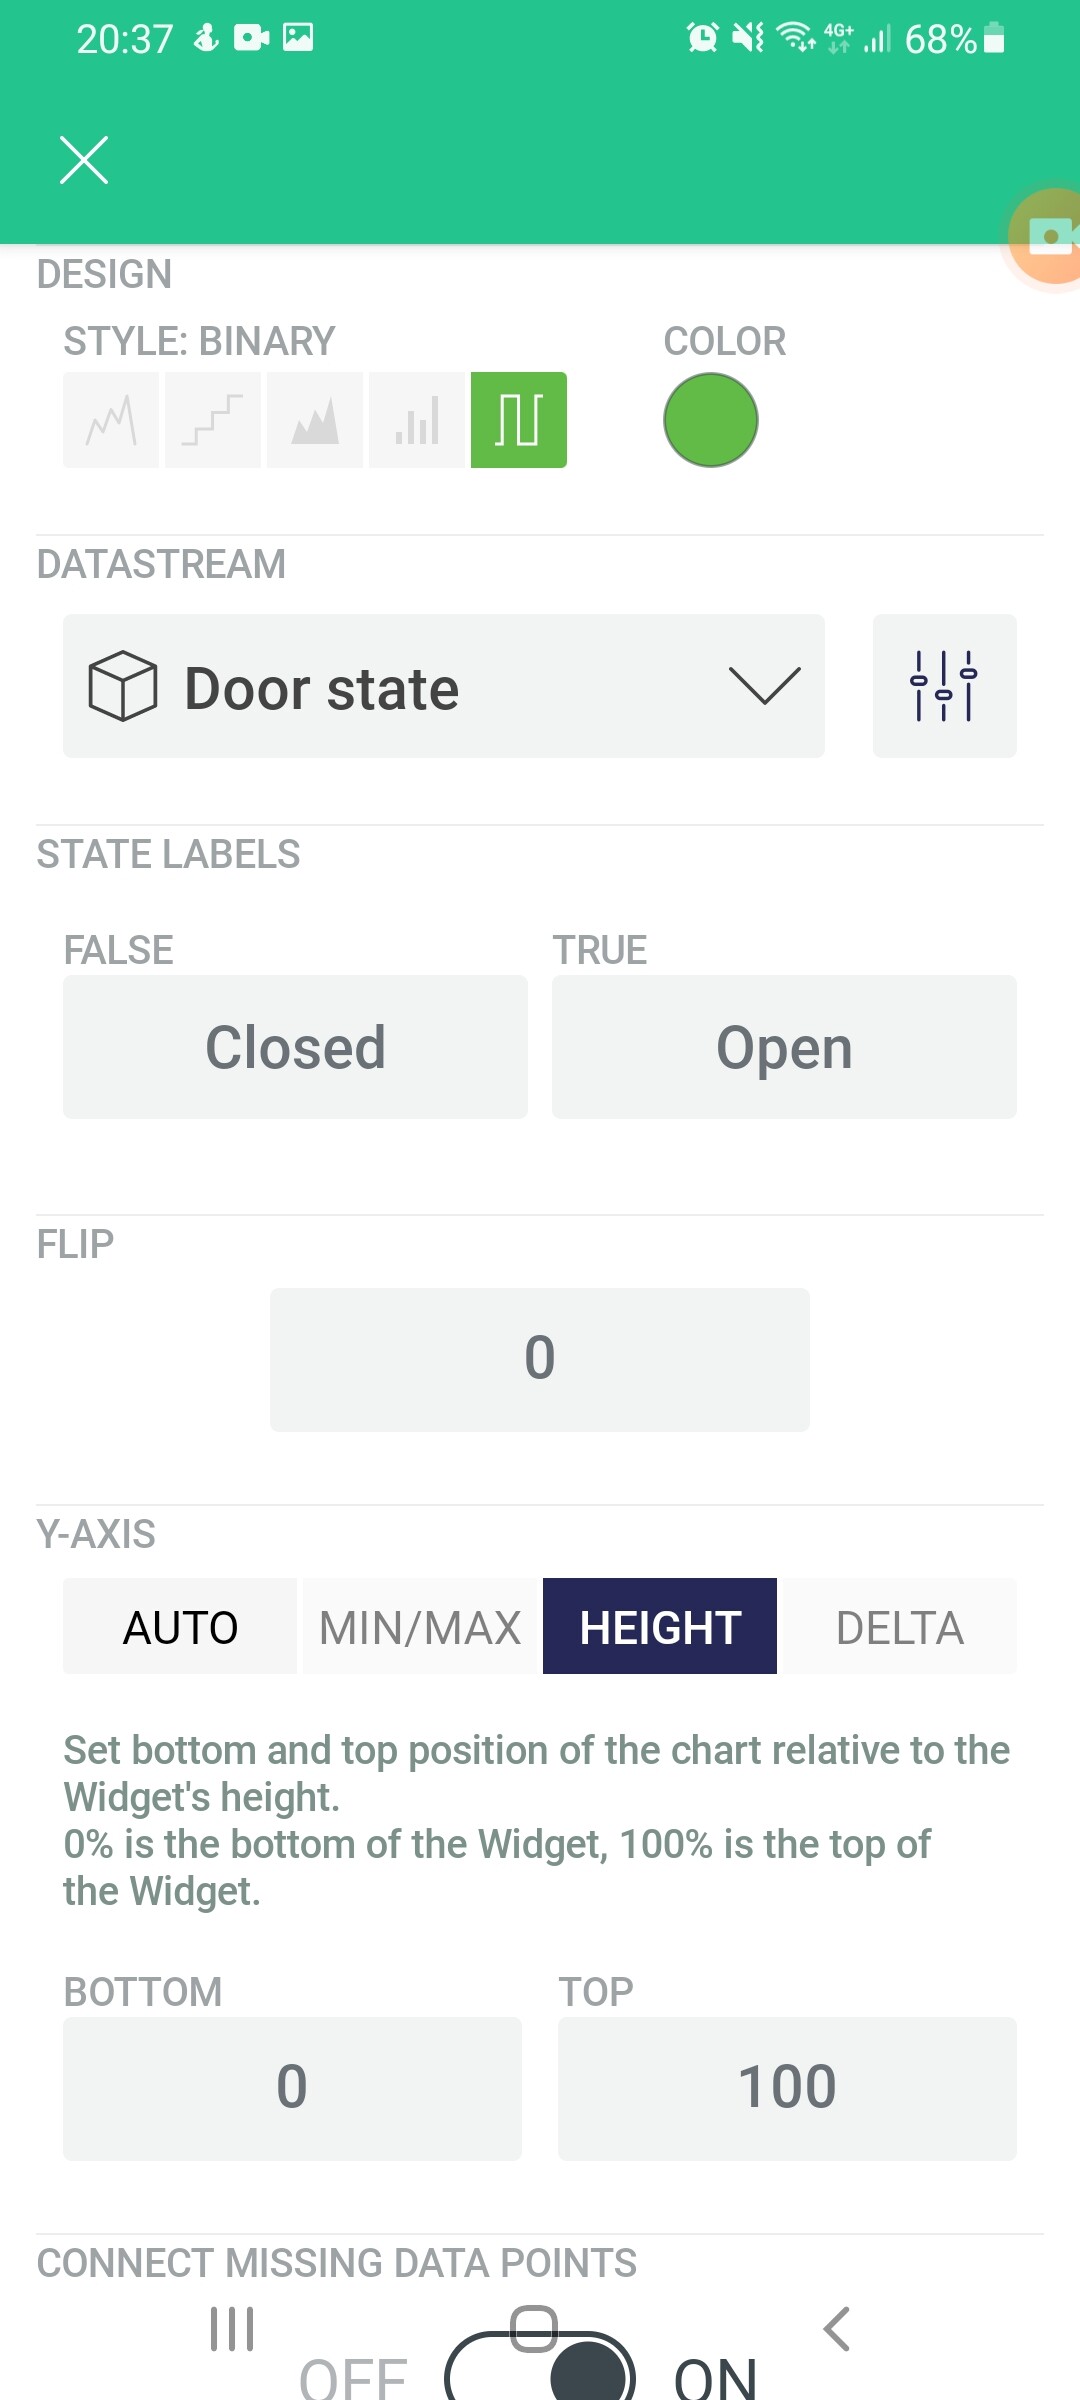
Hi, I’ve applied the update and can see the Flip field now, but it is not saving the value I set. With Height setting, I used 50% as the Flip point, and with Auto I used 127 but they would not be retained after closing the setting page. The screenshot with 50% in the Flip field is the value I set. The other screenshot with 0 in the Flip field is after I closed and reopened the settings view.
It is worth noting that the Superchart does not respond to the new settings, so it appears that the new values are not only affecting the UI but aren’t being applied to the chart
I can’t add more than one datastream to the SuperChart. It lets me add a second one, but it’s greyed out & doesn’t display. Also, + Add Datastream is disabled after you add the second.
This is in the Free version - do I need a subscription for more than one datastream?
I was confused by it allowing me to add two - but then only display one. I’m guessing that is a bug.
The web console behaves as per your replay & only allows one datastream to be added - but the mobile one has slightly different behaviour even though the end result is the same.