Hello!!
Is there a way to calculate and display the value of the area under the curve that shows up in the blynk graph widget? Need to calculate the velocity * time for an accelerometer project to calculate the displacement which is dynamic and varies with time in a random manner. Thanks for the anticipated help!
Hello. I think the simplest way would be to download the raw data for your device from blynk and apply the required formula to it.
This sounds similar to something I’m doing with my little solar power generating system that is used for my outdoor lighting system.
I interrogate my solar controller every six seconds (makes the maths easier) and get the latest load wattage and latest solar panel output wattage. As well as writing these values to my chart widget, I accumulate daily running totals for these readings and divide the results by time to give me watt/hour values.
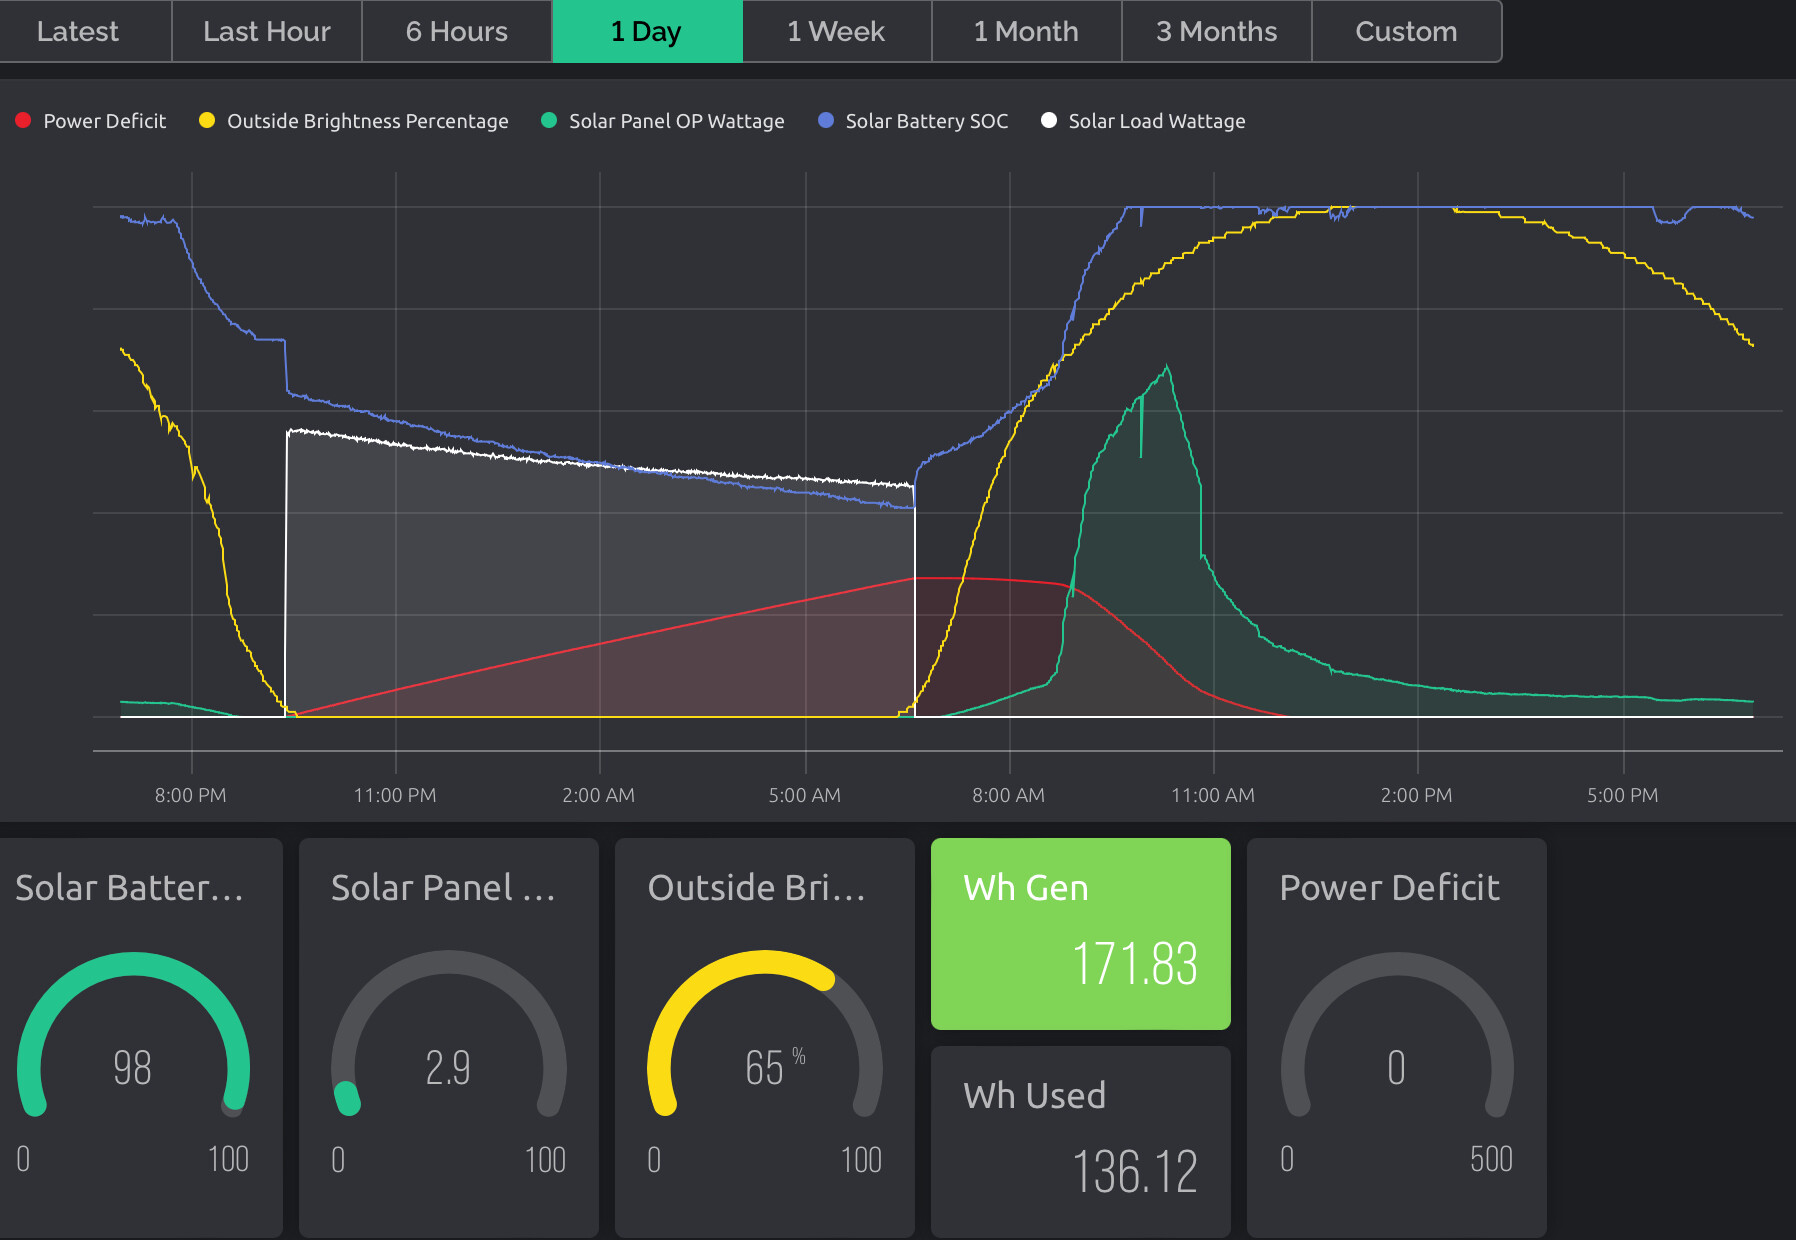
In the screenshot below, the white line/area is the load and the green line/area is the power generated.
The values shown below (Wh Used and Wh Generated) are the sum of the readings over time. This, in effect, gives me the area below the two curves and allows me to compare one with another despite the “curves” being very different shapes…
I do all of this in Node-Red, because the data goes via Node-Red anyway and it’s the simplest way to do things for me, but you could do a similar thing on your MCU.
Note to self - time to re-visit my web dashboard and tidy-it up!
Edited to add, the scales on the power used an power generated datastreams are different, which is why the areas below the curves don’t visually appear to back-up the numbers.
Pete.
2 Likes
Thanks. Exactly what i am doing now. However, its an offline way of calculation, which i cant display back on the monitor at regular intervals (if not real time). The only way of doing it is like downloading the data at fixed intervals from blynk cloud (can we do that?), triggering a macro to do the area calculation in excel or google sheet, uploading it back into the blynk app. Maybe use IFTTT or something similar. Looks quite cumbersome. Is there any alternate or elegant method of doing this, I wonder!
The graphs look awesome! When you say “sum of the readings over time”, it’s just the sensor readings at particular intervals, say every six seconds, and adding them up. Unfortunately in my case, the sensor may not be active for the 5/6 hrs and then suddenly start some activity for 2/3 seconds and then become inactive again. So what i will have to do is check my sensor every second, if no activity, record the displacement as zero; if any activity, measure the velocity and calculate the displacement value as (velocity * 1 sec) and sum it up continuously…Is that what you are hinting at? Can you please share the code snippet that you have used for this? Thanks
I main two values:
- Number of readings taken
- Accumulated value
So, when I take a reading I add one to the “Number of readings taken” and add the value that I read to the “Accumulated value”.
If, after resetting both to zero, I take 3 readings and the values are 10, 11 & 12 then my “Accumulated value” would be 10+11+12 = 33
Because I’m trying to convert periodic wattage readings to Watt Hours I then have to do more maths. In my case I take 600 readings per hour, so it’s something like (Accumulated value/Number of readings taken) x (Number of readings taken/600)
As I said, it’s all done in Node-Red, which is a combination of a graphical programming system and functions written in NodeJS, so not really something that I could share in a meaningful way.
Pete.
Got it, thanks. So if I do something similar for every 1-sec interval and add it to the Accumulated value, it will be an approximation of the area under the curve (although the velocity may change within the 1 sec, will have to live with that). Trust that is what you are suggesting as a work-around.
I think so. It’s a bit difficult to say without more detail.
I guess that if you already have a method of calculating this by downloading the uploaded values then the formula won’t be that different.
Pete.