Project DAQIRI - Digital Air Quality Index Real-time Interrogator
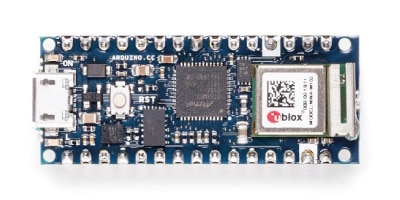
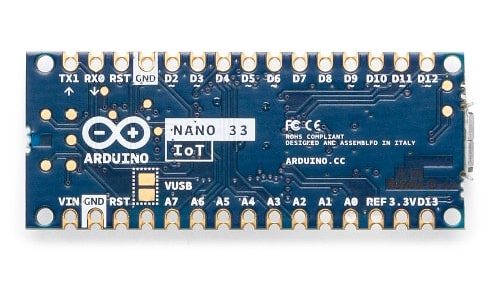
Arduino announced the arrival of 4 new NANO boards in 2019 – the Every, 33 IoT, 33 BLE, and 33 BLE Sense. After checking out the YouTube video about all of them from the man with the Swiss-Army Knife knowledge of all things Arduino at Andreas Spiess, I decided I would up my skills knowledge on the Nano 33 IoT (Internet of Things) board. It has a full blown Nina W102 ESP32 WiFi chip and antenna on one end of the board, and a SAMD21 Cortex®-M0+ 32bit low power ARM MCU microprocessor on the other end clocking at 48 Mhz, all on a standard Nano-sized PCB board running on only 3.3 volts:
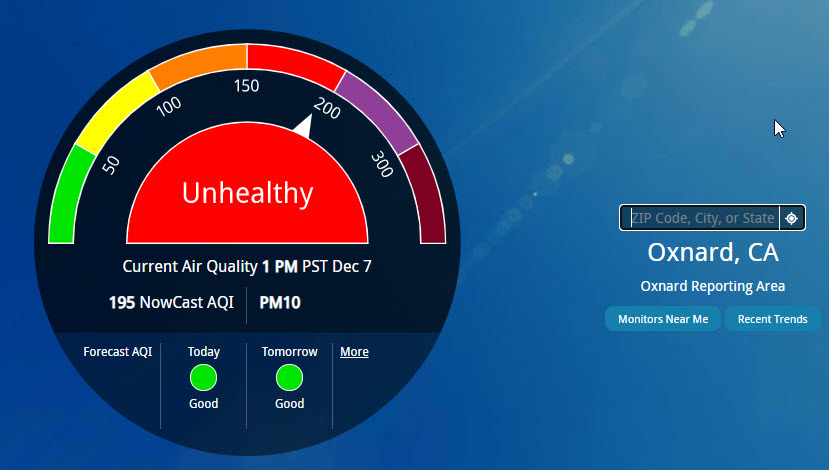
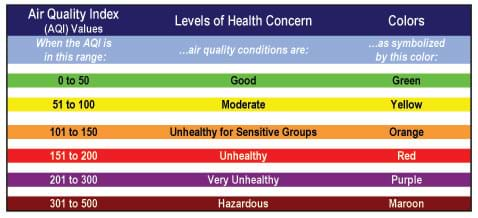
My wife usually goes walking every morning, but not without checking the AQI (Air Quality Index) on her iPhone first to decide if she’s walking outdoors at our local park or walking indoors at our local mall. The AQI data seems to be refreshed every two hours on the AirNow.gov website. They provide a browser interface to all their data accessible by zip-code or GPS coordinates, as well as direct API access to their Apache-Coyote webserver with HTTP query commands. To make gearing up on the Nano 33 interesting, I decided to tackle using the Nano 33 ESP32 WiFi to talk to the AQI server with an Arduino sketch. Here is what their web browser display looks like after querying two different zip codes, and the index breakdown on the 6 color ranges shown for 8 air quality particulates that can be measured:

First I read up on the “33” at: Nano 33 IoT Ultimate Guide. What some people say is 100% compatible with the original Nano is more like 98.6%. The board runs on low 3.3 Volt power; don’t apply 5 Volts directly to any I/O pin or you can damage it. If you power the board thru the USB hub, you must first solder a jumper-pad to route 5 volts from the USB to the 5V board pin if you want to use it to power your old 5 volt peripheral add-ons. If you instead apply power thru the normal Vin pin, you also have to supply your own 5 volt power. Rather go into all the other caveats, read the article first, and also the one by MakerGuides at: Arduino Nano 33 IoT Guide. Notice above that the silkscreen pin names stencil is printed on the bottom of the board, not on top … a disadvantage to all hobbyists like me trying to use it. Also notice there are no components on the bottom side of the board, so it can be directly soldered to another PCB board.
After rummaging around the Internet for sample Air Quality Index sketches for the Arduino, I hit the jackpot and came across this great article about the The 21st Century Digital Home, written by Anne Barela, who is an advisor and contributing editor to Adafruit. She documented a project done by none other than Lady Ada herself interfacing an Arduino to the AirNow AQI service thru Ethernet. I replaced the Ethernet layer of code with a WiFi ESP32 layer, embellished the code to do some new things, added zip code profiles, and viola! The challenge was that the TFT display used to show AQI information is no longer available at Adafruit or sold on eBay, so I improvised with the standard Arduino 16X2 LCD display for now. I may try out a newer TFT display from Adafruit later.
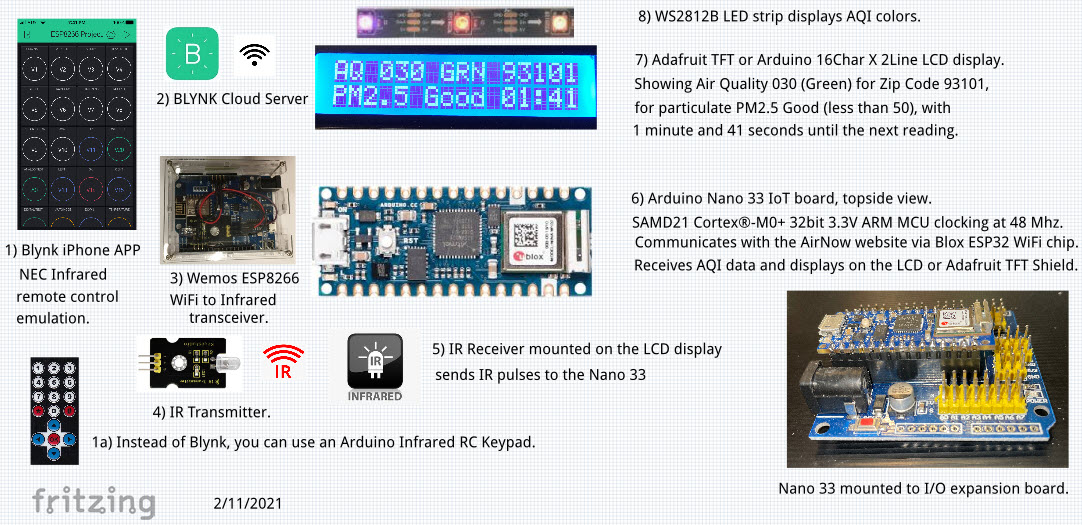
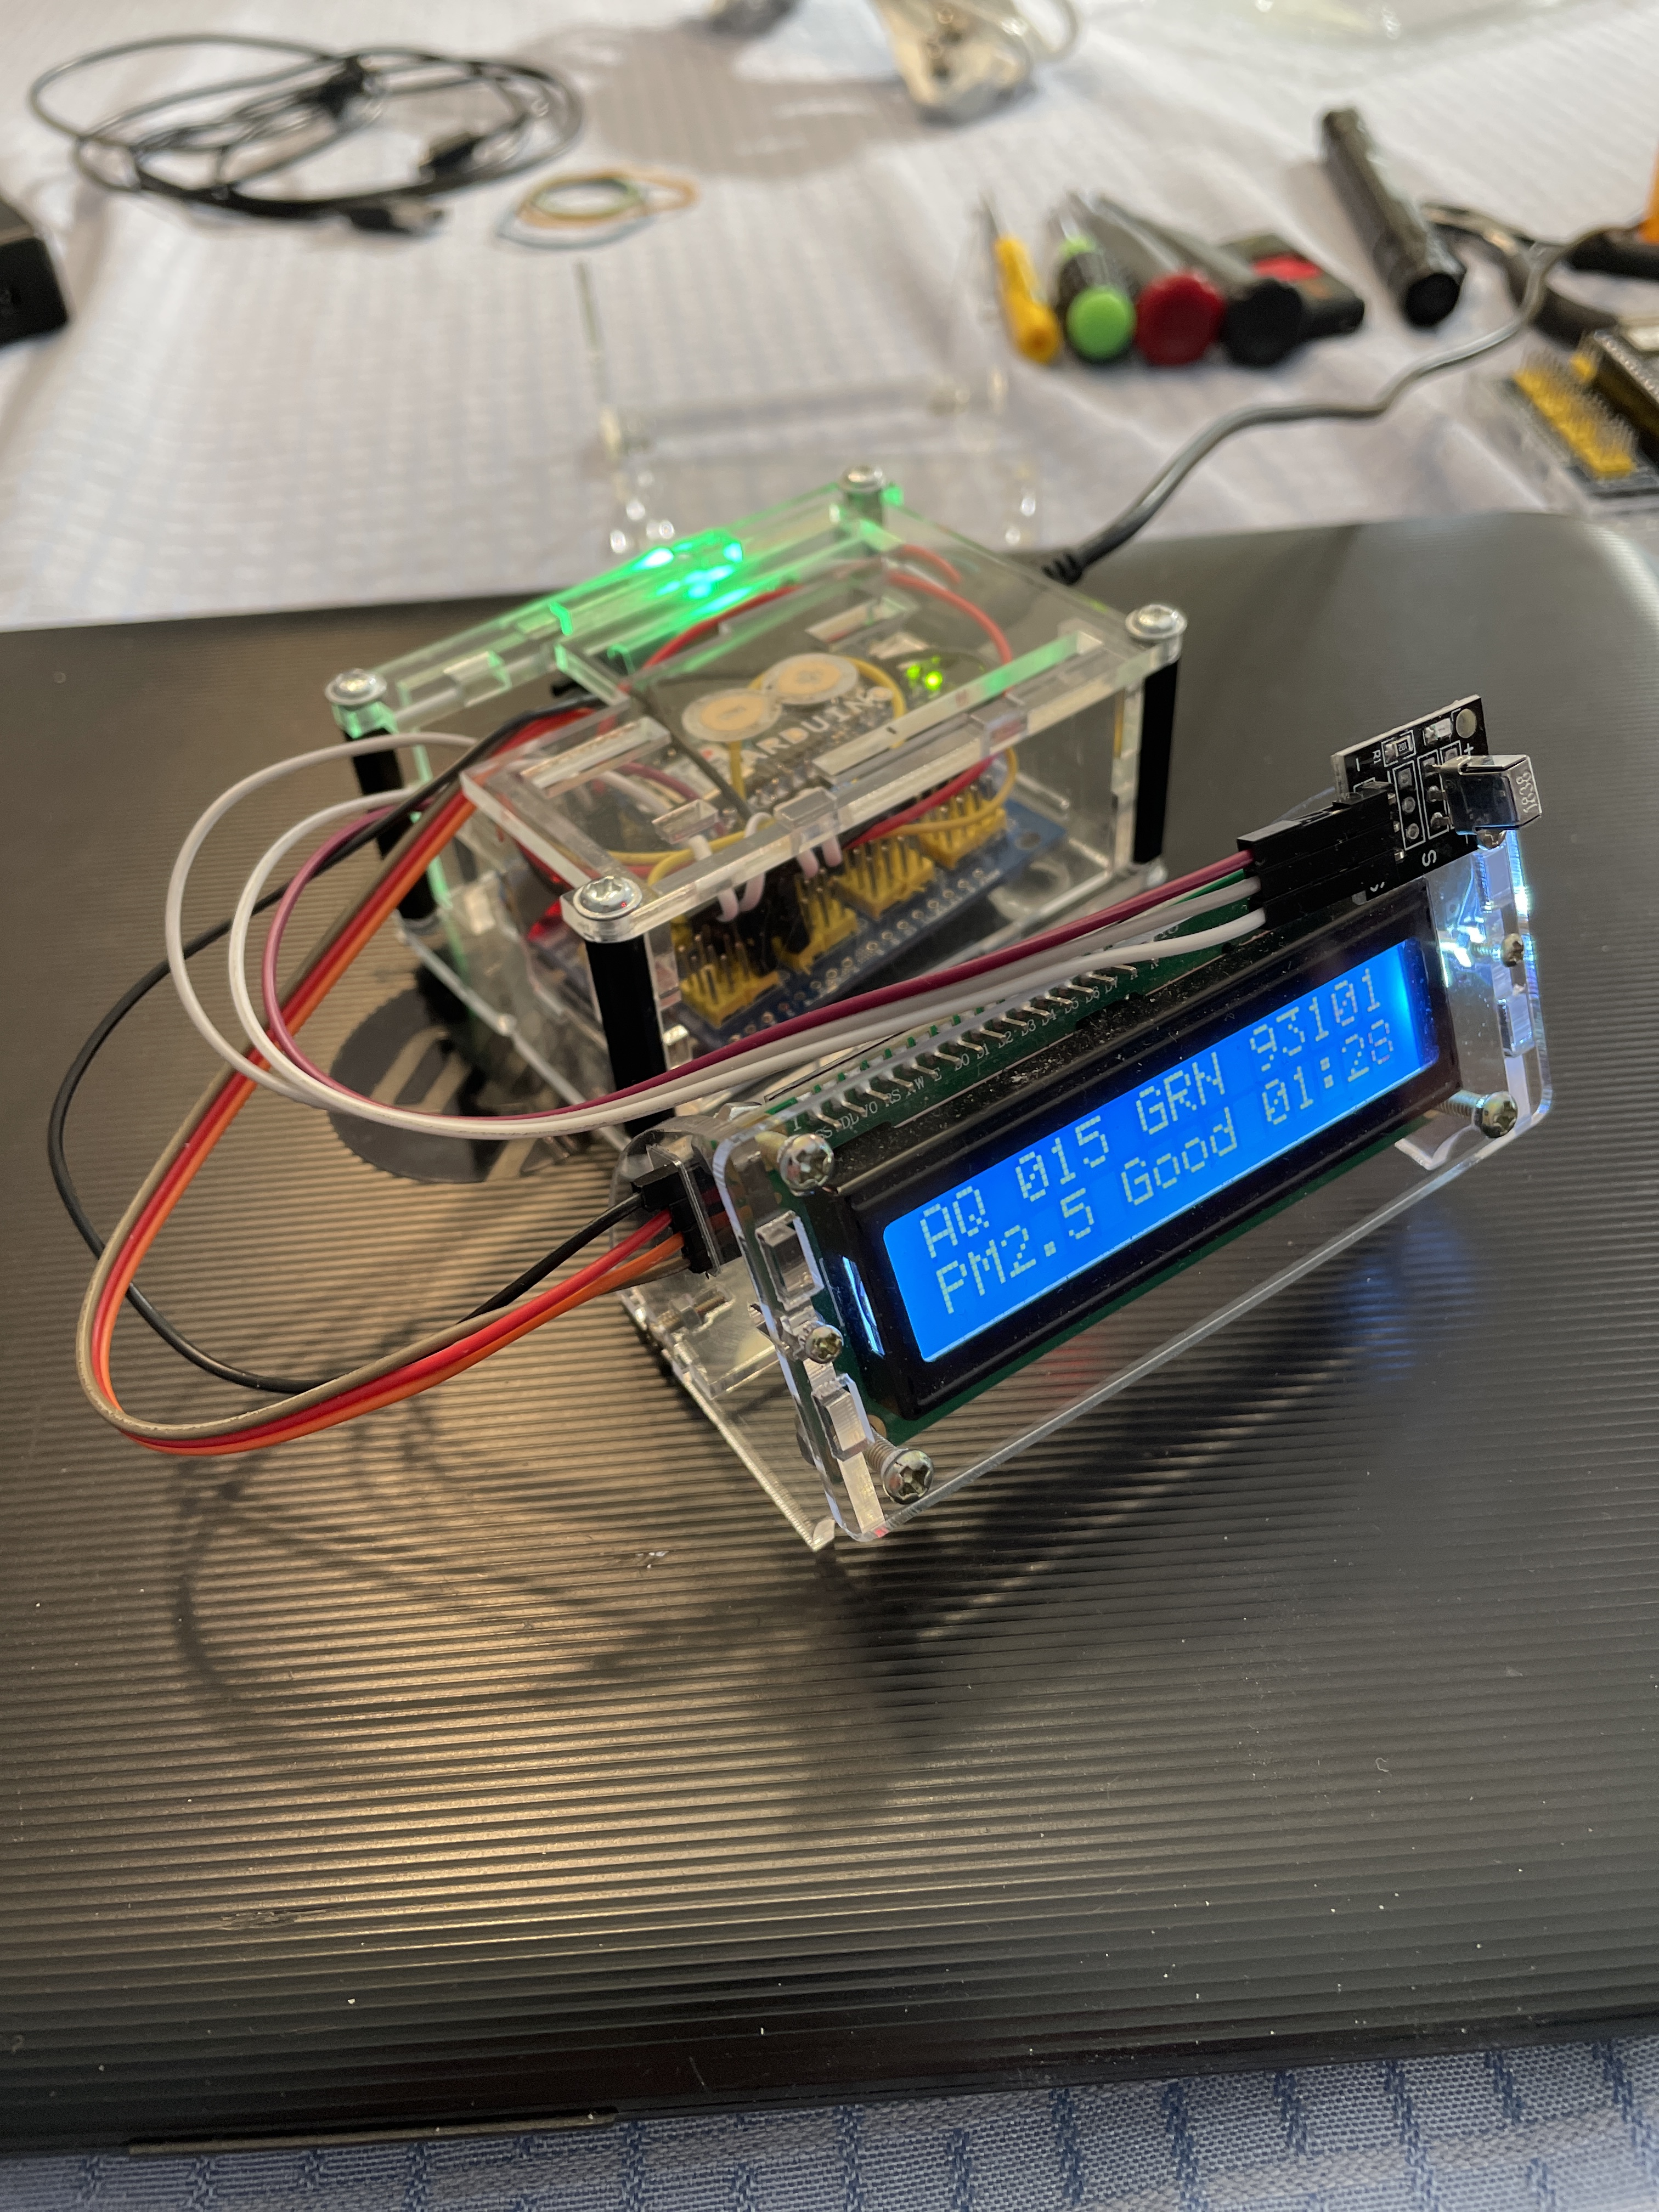
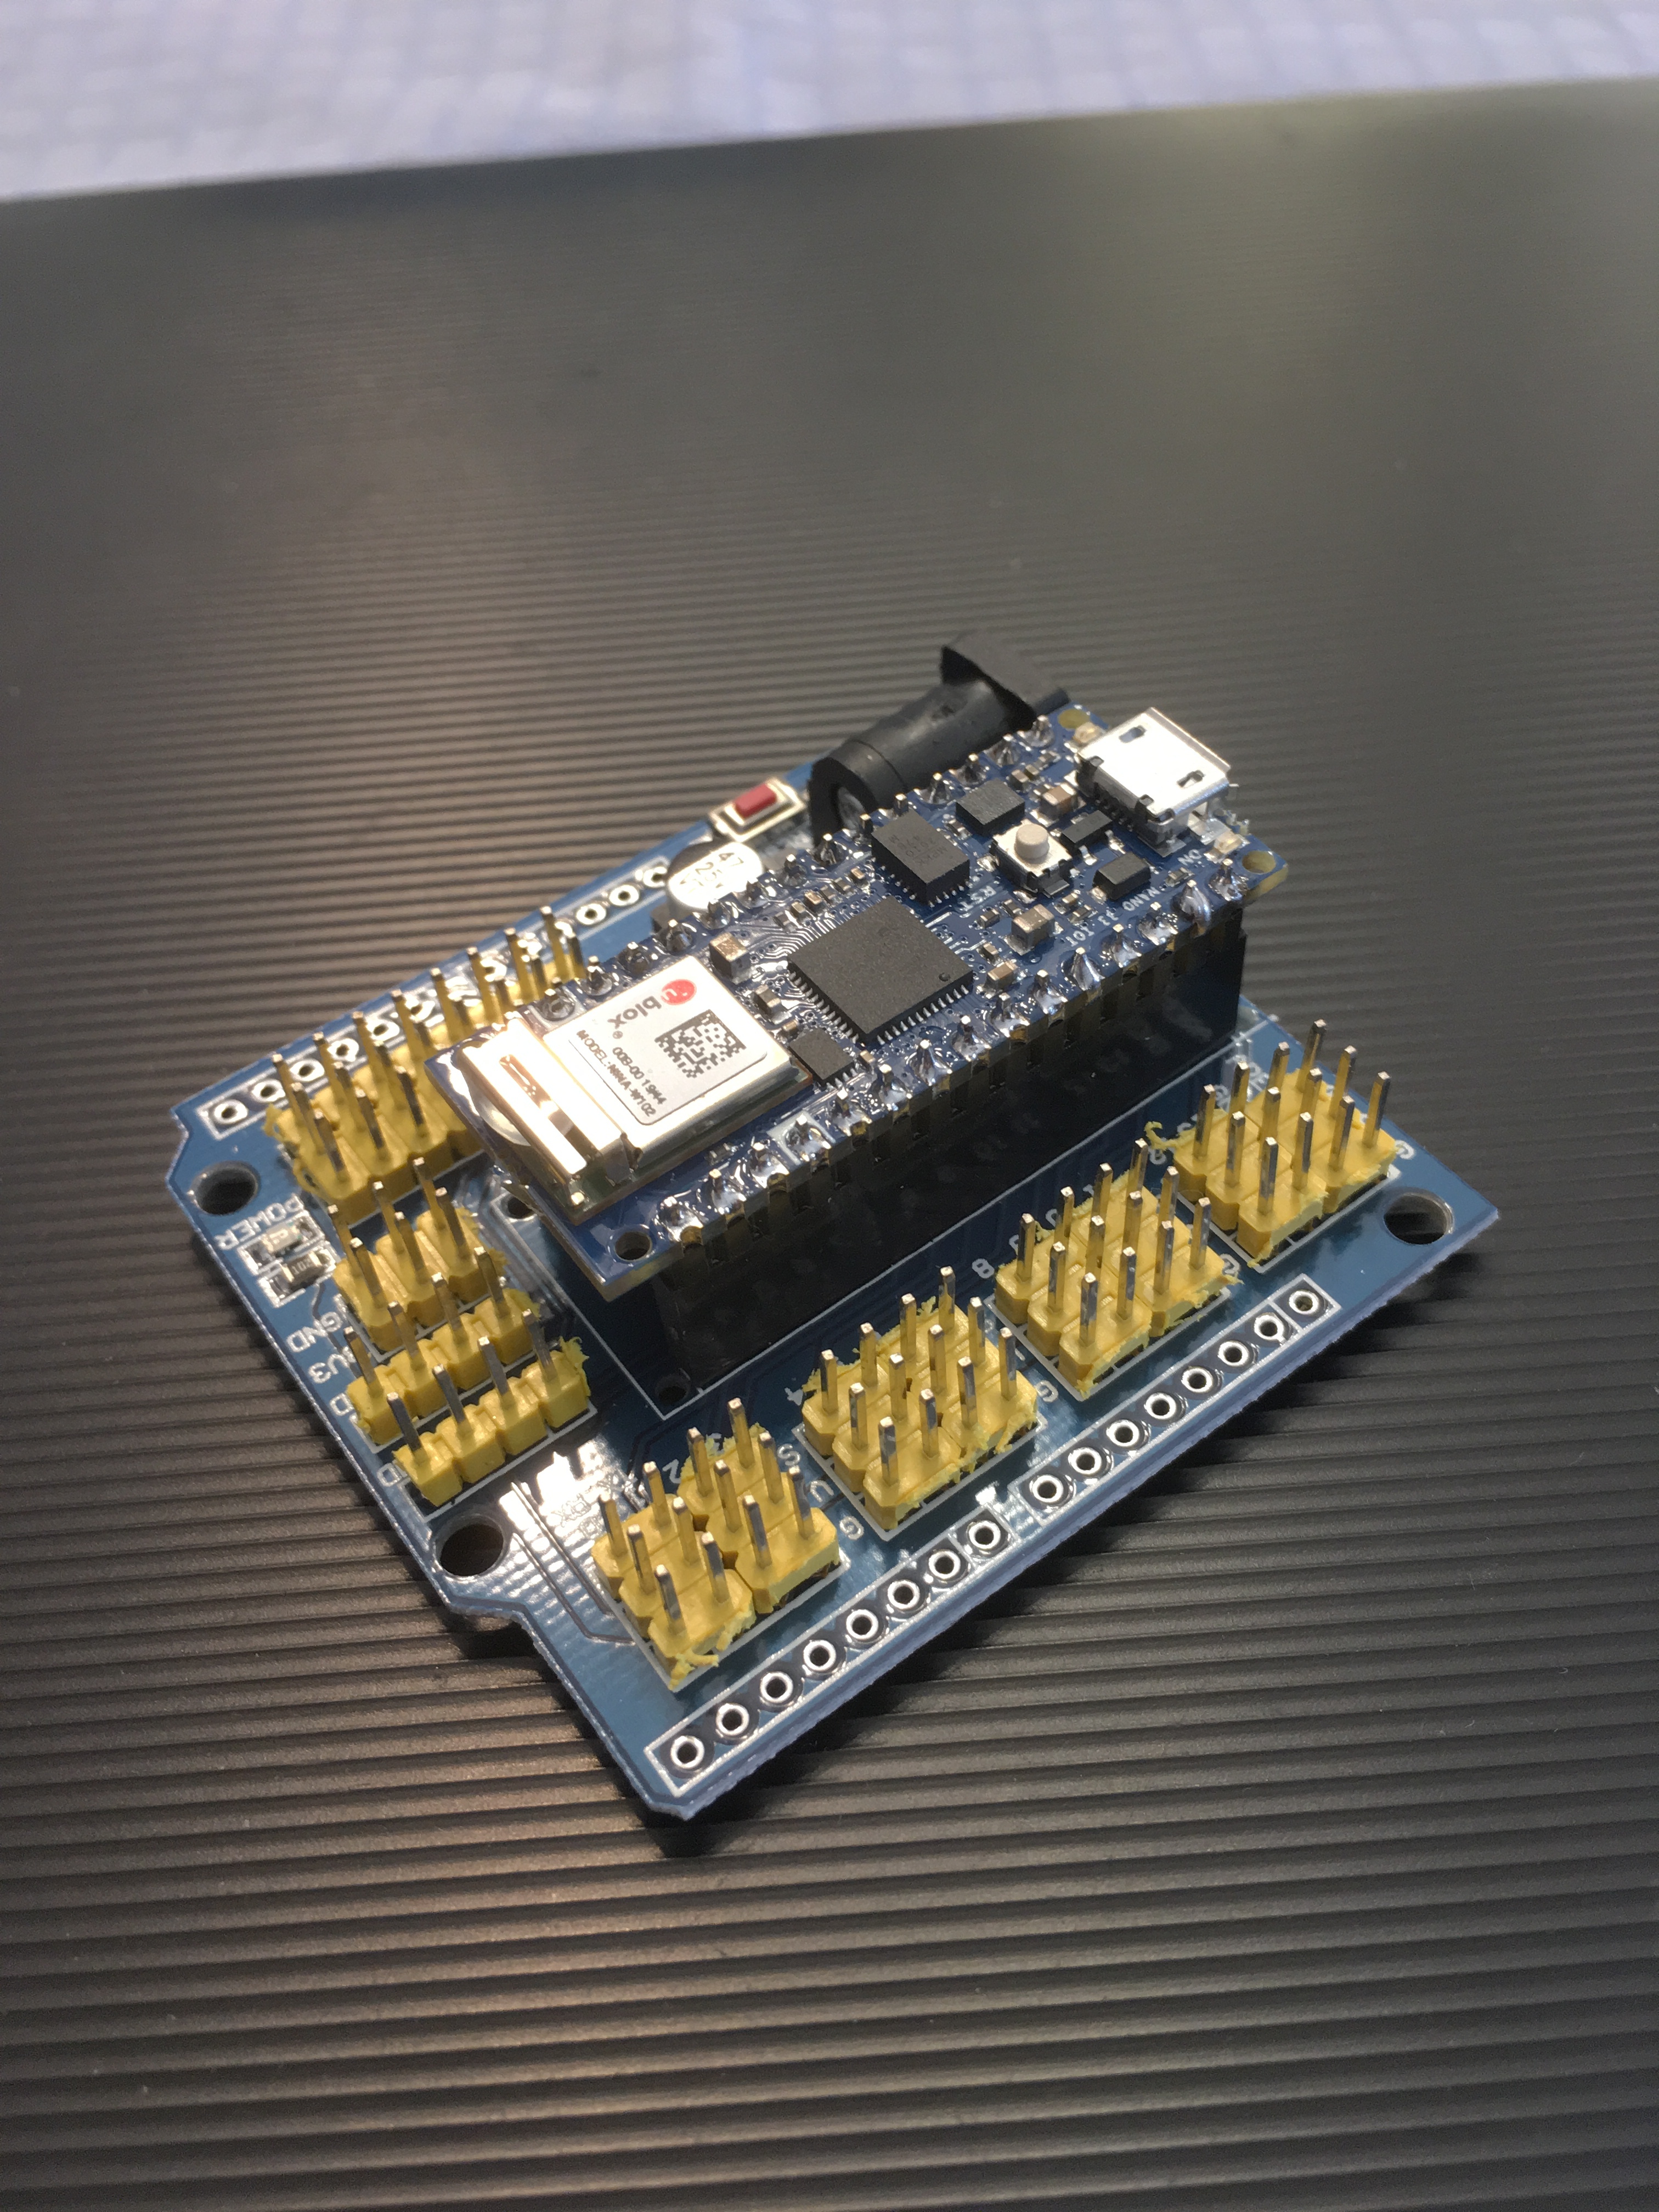
Take the Nano 33 IoT board, insert it into a Nano prototype shield, add a VS1838B IR receiver and mount it on an HD44780 compatible 16X2 LCD display, add a 1-LED WS2812B strip to display AQI color, finish off with some plug-board wires, power it all from a 5 volt power supply with a USB micro hub connector, and that’s all you need. Here are the three stages of development, complete with the LCD display output after querying the AirNow server using HTTP Arduino commands. The AQI color is shown as GRN (green) on the LED strip:

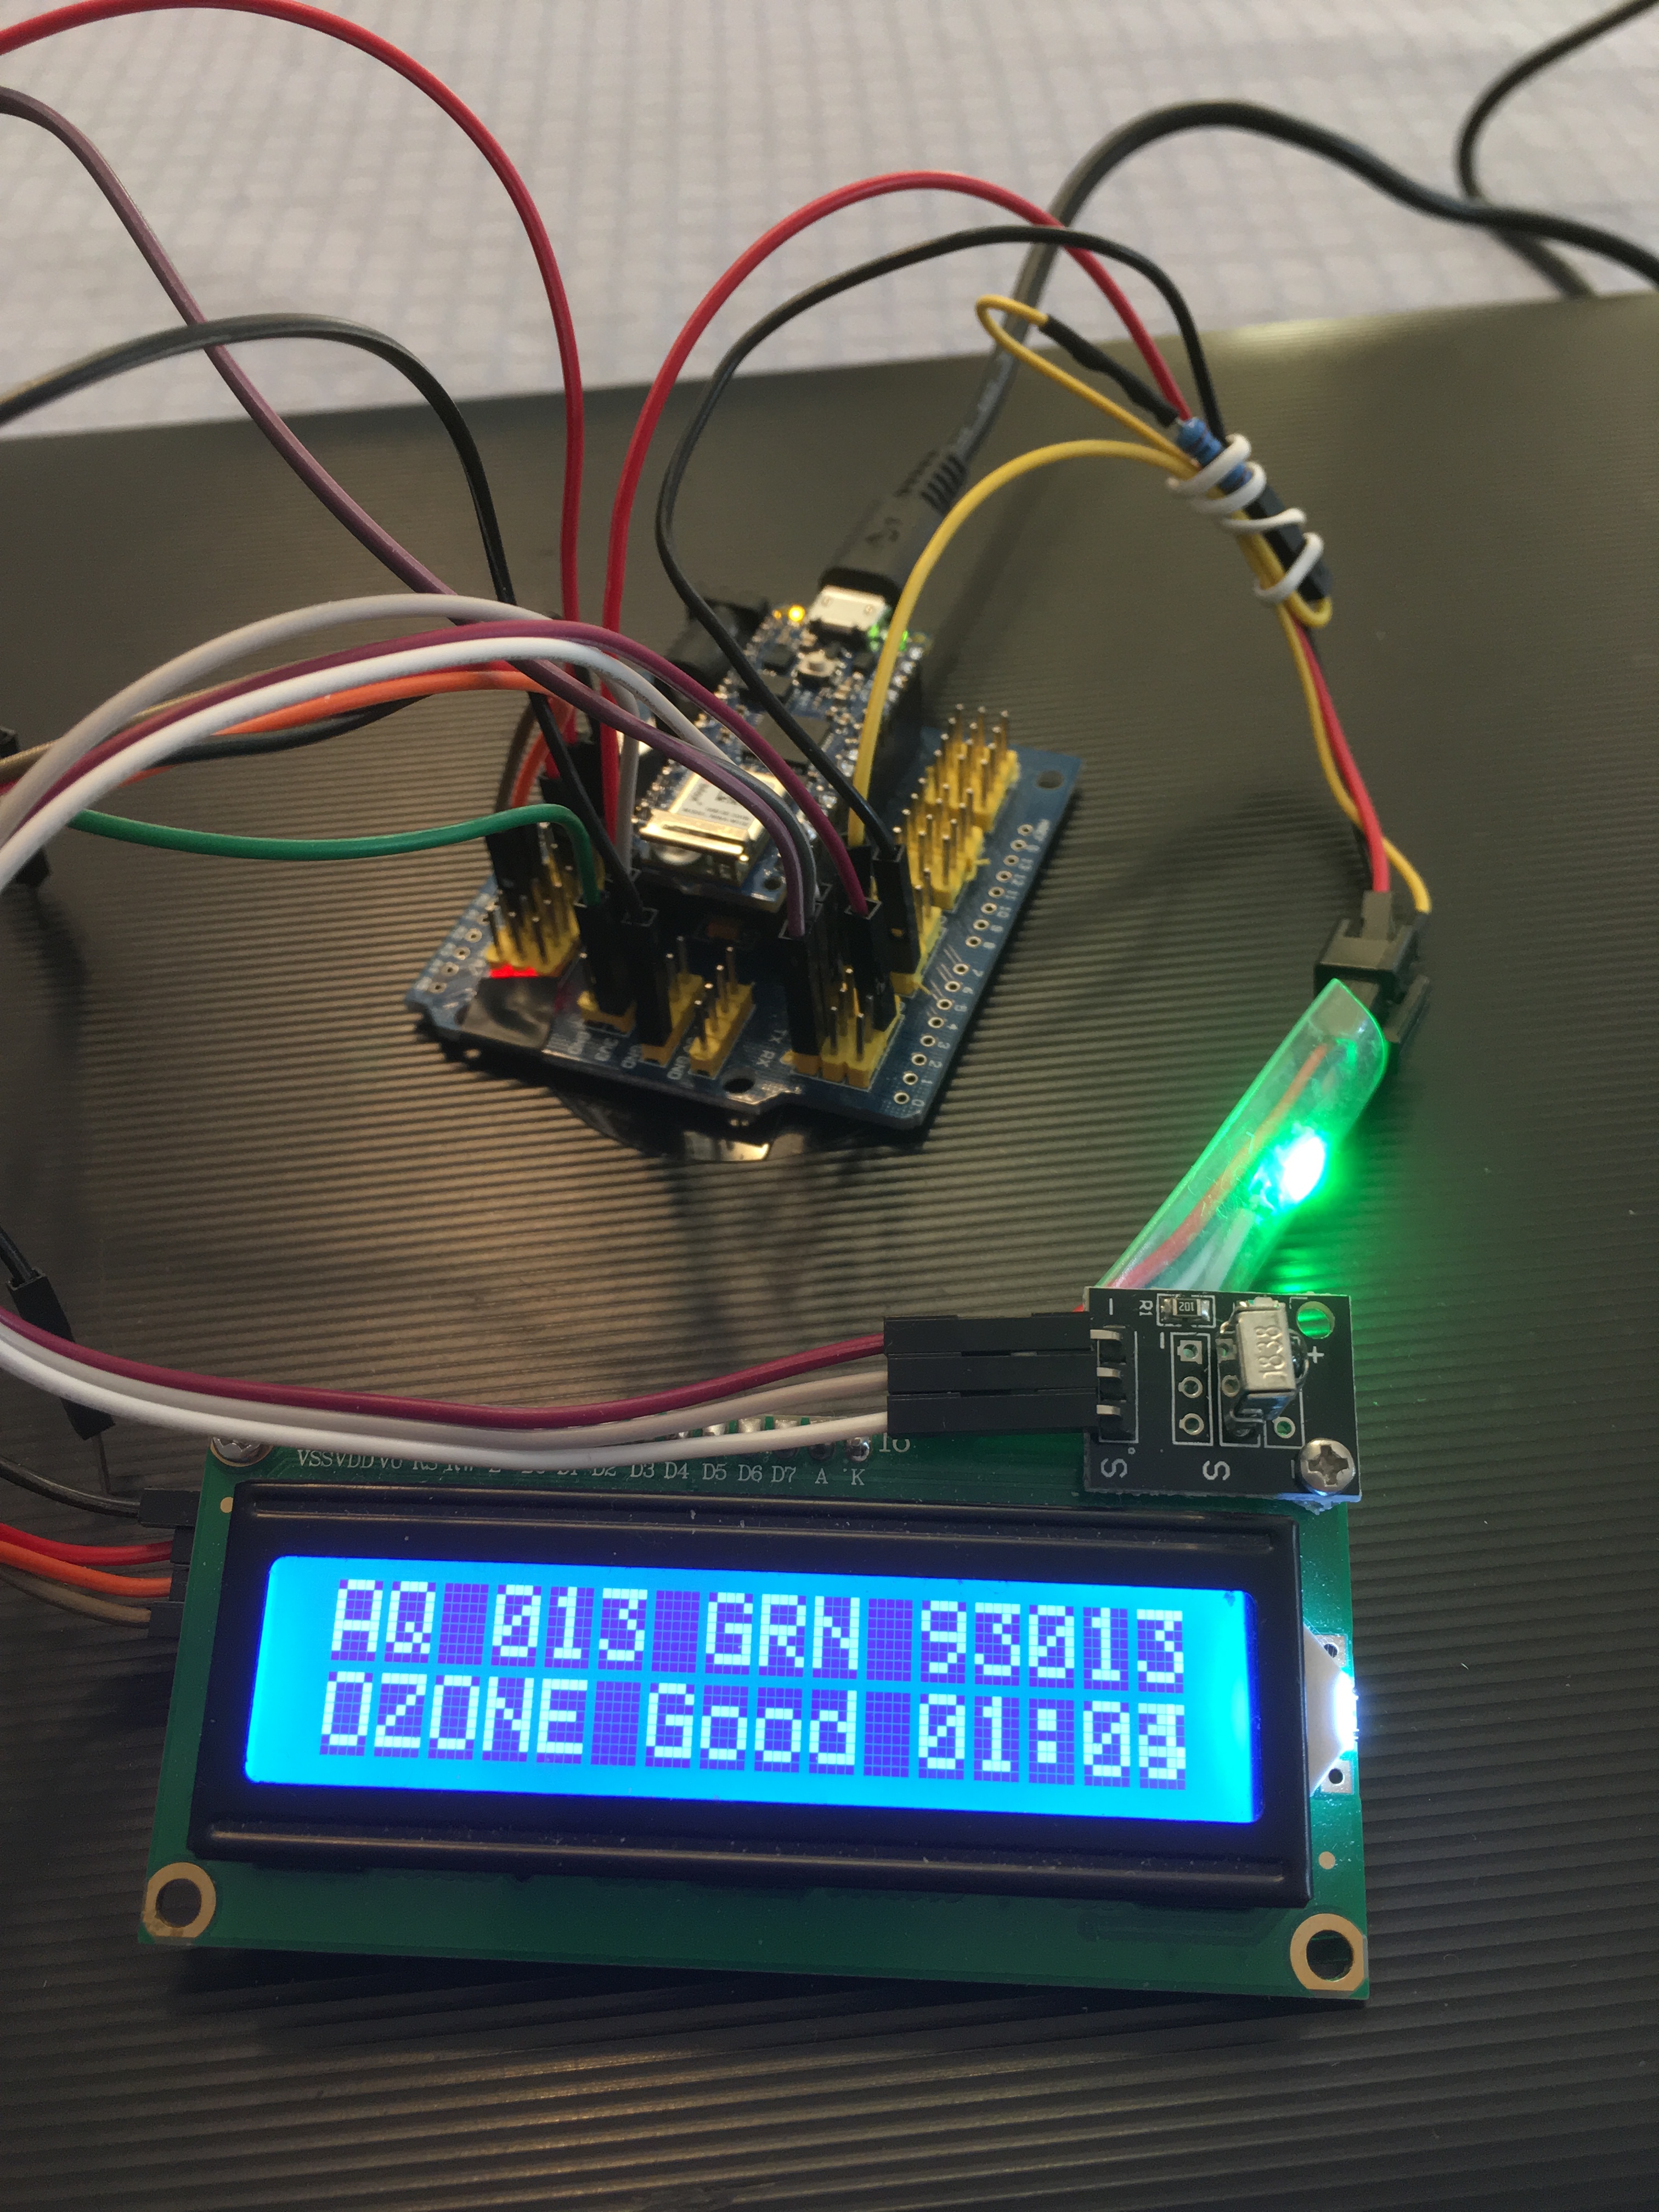
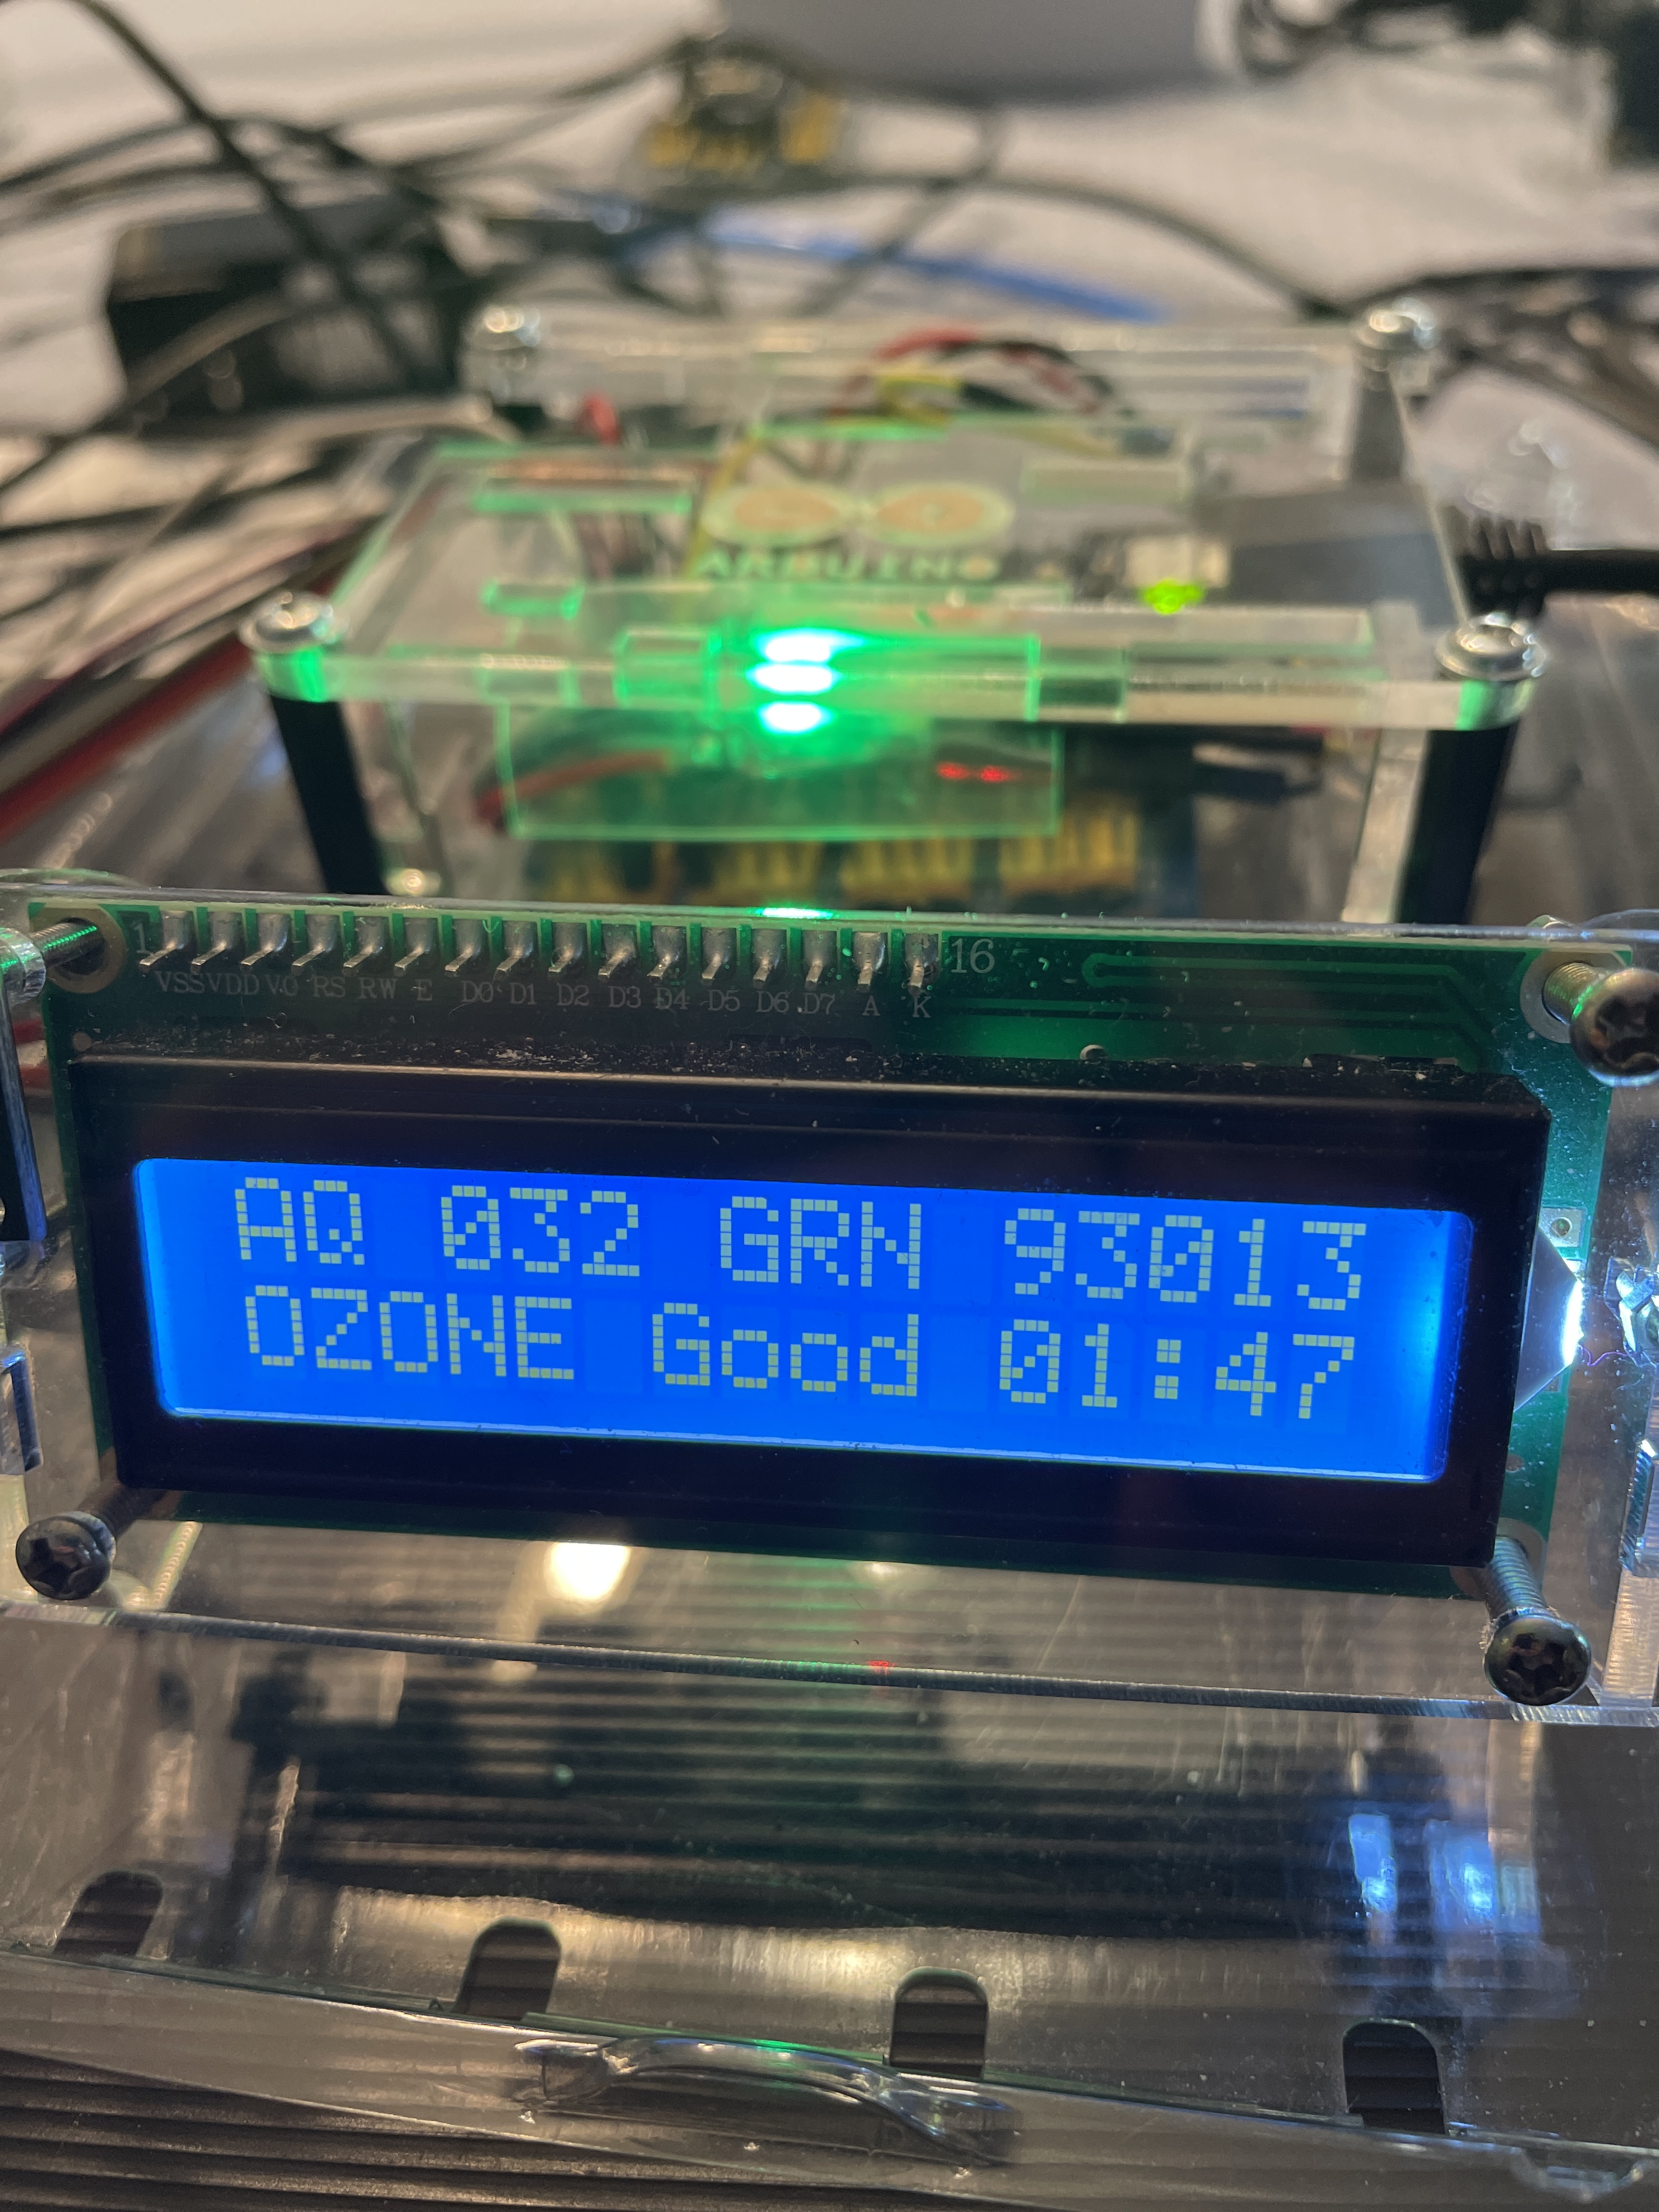
The AirNow status is shown on the LCD screen as AQ level 013 GRN (Green) in Zip Code 93013 for particulate type OZONE as Good (less than 50). The Nano queries the AirNow server every 30 minutes; there is 1 minute and 4 seconds remaining until the next update.
Here is a sample AirNow AQI HTTP query session using Zip Code 93110 (Santa Barbara). AQI values were returned for Ozone, PM2.5, and PM10, then sorted and the status was displayed for the one with the highest reading:
15:07:00.823 ->
15:07:00.823 -> NANO 33 IoT  "DAQIRI"  Version 12-19-20
15:07:00.823 -> Digital Air Quality Index Real-time Interrogator
15:07:03.863 -> Location profile 1 -- Tom's List
15:07:03.863 ->
15:07:04.615 -> Note: Arduino firmware is back-level; please upgrade it
15:07:04.708 -> Connecting to WiFi access point:  ..
15:07:10.788 -> Connected to SSID: MyHomeRouter
15:07:10.788 -> local IP Address: 192.168.1.128
15:07:10.788 -> RSSI signal strength: -49 dBm
15:07:13.921 ->
15:07:13.921 -> Starting connection to remote server...
15:07:18.089 -> You are now connected to server www.airnowapi.org
15:07:21.128 -> Query Zipcode Profile 1 location 1 -- Santa Barbara CA  93110
15:07:21.128 -> GET /aq/observation/zipCode/current/?format=text/csv&zipCode=93110&distance=25&API_KEY=xxxxx-xxxx-xxxxx HTTP/1.1
15:07:21.175 -> AirNowAPI Request sent
15:07:21.175 -> Connection: close
15:07:22.247 -> 1: HTTP/1.1 200 OK
15:07:22.247 -> 2: Server: Apache-Coyote/1.1
15:07:22.247 -> 3: Content-Disposition: attachment; filename=Output.csv;
15:07:22.247 -> 4: Content-Type: text/csv;charset=UTF-8
15:07:22.247 -> 5: Content-Language: en-US
15:07:22.247 -> 6: Content-Length: 401
15:07:26.354 -> 7: Date: Sat, 19 Dec 2020 23:07:25 GMT
15:07:26.354 -> 8: Connection: close
15:07:26.402 -> 9:
15:07:26.402 -> 10: "DateObserved","HourObserved","LocalTimeZone","ReportingArea","StateCode","Latitude","Longitude","ParameterName","AQI","CategoryNumber","CategoryName"
15:07:26.402 -> 11:> "2020-12-19 ","14","PST","Goleta","CA","34.4453","-119.8277","O3","32","1","Good"
15:07:26.402 -> --> Data[0]: O3
15:07:26.402 -> --> Data[1]: 32
15:07:26.402 -> --> Data[2]: 1
15:07:26.402 -> --> Data[3]: Good
15:07:26.402 -> -----------------------------
15:07:26.402 -> Type: OZONE
15:07:26.402 -> Value: 32
15:07:26.402 -> Color: GREEN
15:07:26.402 -> Air Quality: Good
15:07:26.402 -> -----------------------------
15:07:27.054 -> 12:> "2020-12-19 ","14","PST","Goleta","CA","34.4453","-119.8277","PM2.5","0","1","Good"
15:07:27.054 -> --> Data[0]: PM2.5
15:07:27.054 -> --> Data[1]: 0
15:07:27.054 -> --> Data[2]: 1
15:07:27.054 -> --> Data[3]: Good
15:07:27.054 -> -----------------------------
15:07:27.054 -> Type: PM2.5
15:07:27.054 -> Value: 0
15:07:27.054 -> Color: GREEN
15:07:27.054 -> Air Quality: Good
15:07:27.054 -> -----------------------------
15:07:27.666 -> 13:> "2020-12-19 ","14","PST","Goleta","CA","34.4453","-119.8277","PM10","15","1","Good"
15:07:27.666 -> --> Data[0]: PM10
15:07:27.666 -> --> Data[1]: 15
15:07:27.666 -> --> Data[2]: 1
15:07:27.666 -> --> Data[3]: Good
15:07:27.666 -> -----------------------------
15:07:27.666 -> Type: PM10
15:07:27.666 -> Value: 15
15:07:27.666 -> Color: GREEN
15:07:27.666 -> Air Quality: Good
15:07:27.666 -> -----------------------------
15:07:29.343 -> $Debug -- 'client.stop' #2 sent.
15:07:32.426 ->
15:07:32.426 -> AQI value 32 (Good) for OZONE is GRN in Santa Barbara CA  93110
15:07:32.426 -> Timer countdown running; AQI HEX [12415149][1] refresh sent to UNO.
15:07:32.473 ->
15:07:32.940 -> Next AQI refresh is in 1800 seconds ...
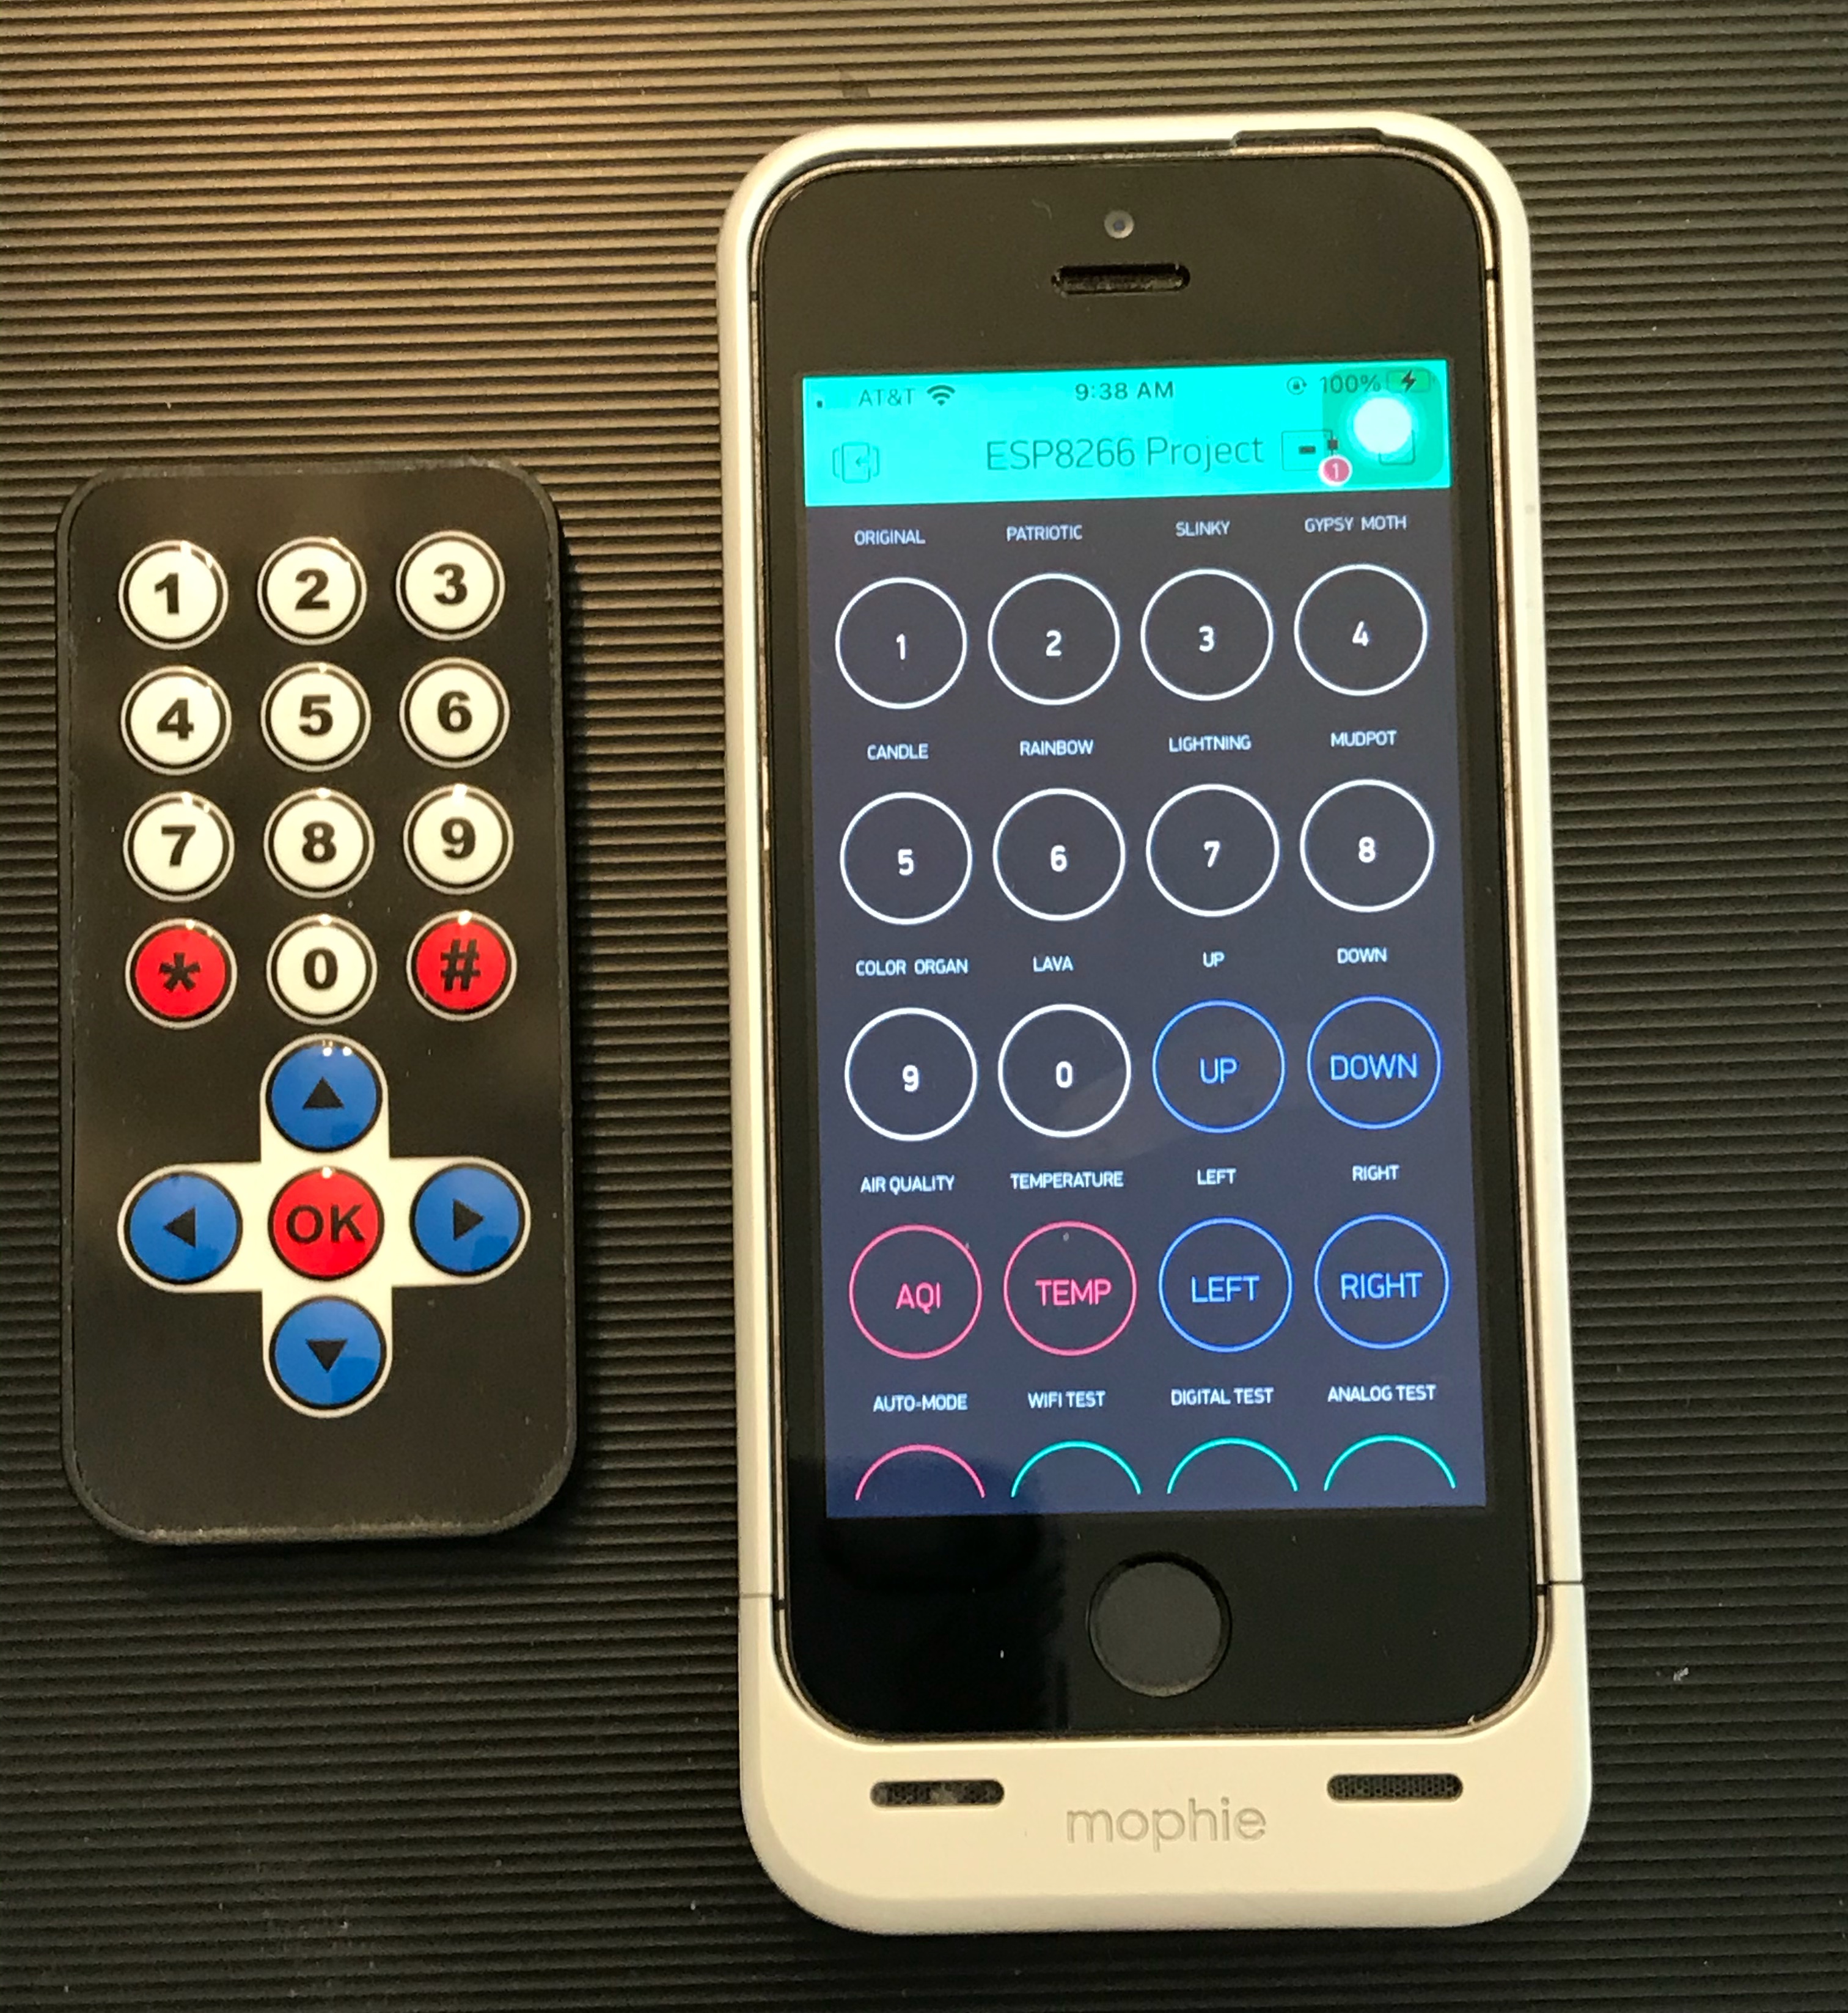
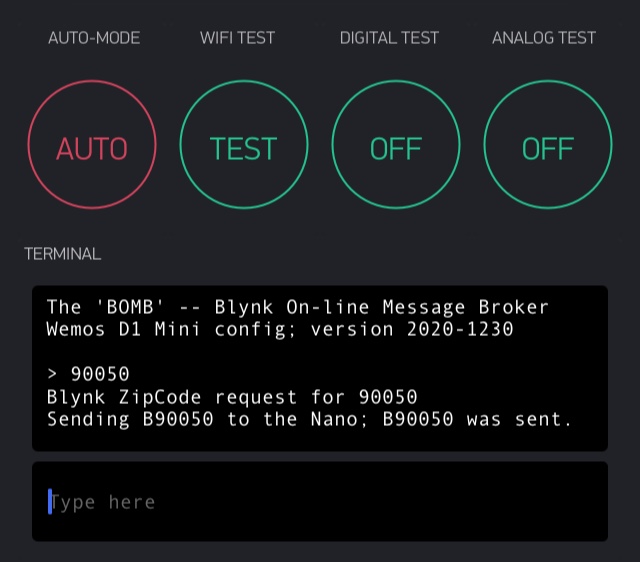
Besides replacing the Ethernet layer of code with some ESP32 WiFi code, I added 4 Zip Code profiles the Nano can cycle thru every 30 minutes. Profile 1 is my brother’s list, Profile 2 is my list, Profile 3 is six canned test zip codes to display each of the 6 AQI particulate level colors, and profile 4 has one zip code slot to display requests sent over from the Blynk App. I soon discovered once you compile the Nano code sketch, you might want to display new zip codes by entering them into the Blynk App ASCII terminal widget instead of recompiling the sketch all over again. The Blynk App that emulates the Arduino remote control keypad is the same one I used to run my digital Salt Lamps in projects posted previously; I just added the new terminal widget to enter zip code requests to send to the Nano:
!
Here below is the “header only” {no setup() or loop()} for the source code.
I’ll post the whole sketch here when finally debugged, or to GitHub if too big.
Arduino sketch code for the Nano 33 IoT board. You will have to add it to your board definitions in the IDE before you can compile this sketch. You will also have to download the fixed (unreleased branch) version of “FastLED.h” that works with the Nano 33.
That fix is documented here: FastLED.h fix for the Nano 33
// NANO 33 IOT Web client talking to AirNow.gov to get AQI data.
// ============================================================
/*
  This sketch connects to a website using the Nano 33 IoT WiFi.
  Original example was written for a network using WPA encryption.
  For WEP or WPA, change the Wifi.begin() call accordingly.
  Needs Arduino Circuit Board with NINA WiFi modules supported:
  Arduino MKR WiFi 1010, MKR VIDOR 4000, UNO WiFi, NANO 33 IoT.
  ----------
  Originally based on very old deprecated Ethernet code:
  https://www.arduino.cc/en/Tutorial/LibraryExamples/ConnectNoEncryption
  13 July 2010 Created by dlf (Metodo2 srl).
  31 May 2012 Modified by Tom Igoe.
  ----------
  Inspired by code from Limor Fried/Ladyada @ Adafruit Industries.
  See her company text credits below.
  See Anne Barela's 2015 post in "The 21st Century Digital Home":
  https://21stdigitalhome.blogspot.com/2015/03/arduino-day-2015-project-air-quality.html
  See also: https://www.arduino.cc/en/Tutorial/LibraryExamples/WiFiNINAWiFiWebClient
  ----------
  28 Oct 2020 Heavily modified by Michael Stoddard @ BaxRoad.com
  converted from Ethernet to NANO 33 IoT WiFi, added LCD display.
*/
  // 2020-1027 - Initial program inception.
  // 2020-1102 - Display SSID name on LCD display.
  // 2020-1120 - Working; doing end-to-end testing.
  // 2020-1204 - Final LCD screen layout.
  // 2020-1207 - Embellished LCD display code, added WiFi "." dots.
  // 2020-1208 - Add TEST Zips to Profile 1 for the 6 AQI colors.
  // 2020-1211 - Add 2nd AQI profile, ZipCodeRoller restart.
  // 2020-1214 - Display AQI 0 as green, not white. Add El Centro CA.
  // 2020-1216 - Add WS2812B library and code. Doesn't compile ..
  // 2020-1217 - Implement Right Arrow to cycle between profiles.
  // 2020-1218 - Display AQI last update Hour and Timezone.
  // 2020-1220 - WS2812B LEDs work after new <FastLED.h> was fixed
  // 2020-1221 - Reset FastLED LEDs on startup until data is acquired.
  // 2020-1222 - Synchronize countdown blinking for LED and D13.
  // 2020-1223 - Play with frozen/resume zip code rolling; TBF
  // 2020-1224 - Set refresh to 2 or 30 min, WS2812B LEDs to 4.
  // 2020-1225 - Add indicator for locked/unlocked zipcode roller.
  // 2020-1226 - Final debug code added, display microcode level.
  // 2020-1229 - Testing Blynk App Zip Code entry.
  // 2021-0110 - Reset timer if no AirNow msgs. after 10 seconds.
  // 2021-0110 - "OK" button refreshes the current Zip Code data.
  //
  // Distributed under royalty-free MIT Creative Commons license;
  // License and credits text must be included in any redistribution.

/***************************************************
  Air Quality Monitoring
  Uses the Arduino Uno, Ethernet Shield, and Adafruit 1.8"
  display shield http://www.adafruit.com/products/802

  Check out the links above for our tutorials and wiring diagrams

  Adafruit invests time and resources providing this open source code,
  please support Adafruit and open-source hardware by purchasing
  products from Adafruit!

  Based on code written by Limor Fried/Ladyada for Adafruit Industries.
  MIT license, all text above must be included in any redistribution
 ****************************************************/

char Version[] = "Version 01/10/21+";

#include <SPI.h>
#include <WiFiNINA.h>
#include <IRremote.h>
#include <FastLED.h>

WiFiClient client;
#define LCDcode

#define NUM_LEDS 4
#define LED_TYPE WS2812B
#define COLOR_ORDER GRB
CRGB leds[NUM_LEDS];
#define LED_PIN 4

#include <Wire.h>
#include <LiquidCrystal_I2C.h>
LiquidCrystal_I2C lcd(0x27, 16, 2);

// Note: TFT HX8304B display no longer available, so this
// code uses the Arduino 16X2 LCD display instead.
// Therefore, the original TFT code is commented out.
// #include <Adafruit_GFX.h> // Core Adafruit graphics library
// #include <Adafruit_HX8340B.h> // TFT display code
Cheers,
Mike S.