I made my weather station with Sparkfuns Thing Dev and optimized it to work for 1,5 month. And I don’t know if my long time working in one session is contributing factor, but when I look at the cvs file on my computer, the graph has loads of unusuall spikes all over without the same in the app. Like the temperature is 9* and next data is 45 which is too much and must be an error. Also, timestamp is also weird. By reading thru forums, the time appears Unix base. Ok, but somewhere, there is a 0 missing on the end to make a sensible time and sometime 3 0s are too much to also make reasonable time.
Does anyone else get this problems too?
Right now I’m “fixing” this by averaging out these error values by averaging one number before and after a few times 
Hello. Please show data that you think is wrong. Also please post code that reads sensor data and sends to Blynk.
This is my code:
// WEATHER STATION BY MATEJ BLAGSIC \\
// RELATED TO INSTRUCTABLE ON WIRELESS WEATHER STATION \\

//#define BLYNK_PRINT Serial    // Comment this out to disable prints and save space

#include <ESP8266WiFi.h>
#include <BlynkSimpleEsp8266.h>
#include <OneWire.h>
#include <DallasTemperature.h>

#define ONE_WIRE_BUS 2//I have my sensor on pin 2
OneWire oneWire(ONE_WIRE_BUS);
DallasTemperature sensors(&oneWire);
char auth[] = "yourCode"; //unique code for your Blynk app

char ssid[] = "ssid"; //name and password for your phone
char pass[] = "password";

float bat; //will store battery voltage in this variable

void setup()
{
  Blynk.begin(auth, ssid, pass);
  sensors.begin(); //this is to initiate my DS18B20 sensor
}

void loop()
{
// Blynk.run();//have this uncommented if your wifi board will expect data from phone app -> if your phone app controlls your wifi module and sends data to it. We only receive data to phone, so you don't need this
  while (Blynk.connect() == false) {
// wait unit the board connects to Blynk server
}
  bat = analogRead(A0); // ->
  bat = ((bat+63) * 1/1023) / (100.1/(100.1+329.5)); // -> We take the reading from adc and turn it into *C -> explanation in instructable
  sensors.requestTemperatures();
  float t = sensors.getTempCByIndex(0); //we store temperature from sensor to variable t
  Blynk.virtualWrite(0, t);//sending temperature on virtual pin 0
  Blynk.virtualWrite(2, bat);//sending battery voltage on virtual pin 2
  ESP.deepSleep(900000000);//board enters deep sleep for 15min (number is in microseconds)

delay(100);
}
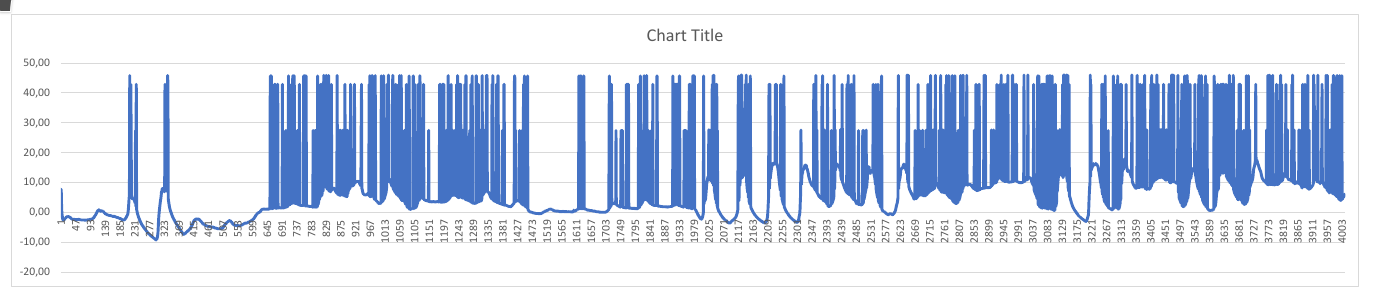
Here’s the code and the plot from excel of the csv file.
// WEATHER STATION BY MATEJ BLAGSIC \\
// RELATED TO INSTRUCTABLE ON WIRELESS WEATHER STATION \\

//#define BLYNK_PRINT Serial    // Comment this out to disable prints and save space
#include <ESP8266WiFi.h>
#include <BlynkSimpleEsp8266.h>
#include <OneWire.h>
#include <DallasTemperature.h>

#define ONE_WIRE_BUS 2 //I have my sensor on pin 2
OneWire oneWire(ONE_WIRE_BUS);
DallasTemperature sensors(&oneWire);
char auth[] = "yourCode"; //unique code for your Blynk app

char ssid[] = "ssid"; //name and password for your phone
char pass[] = "password";

float bat; //will store battery voltage in this variable

void setup() {
    Blynk.begin(auth, ssid, pass);
    sensors.begin(); //this is to initiate my DS18B20 sensor
}

void loop() {
    // Blynk.run();//have this uncommented if your wifi board will expect data from phone app -> if your phone app controlls your wifi module and sends data to it. We only receive data to phone, so you don't need this
    while (Blynk.connect() == false) {
        // wait unit the board connects to Blynk server
    }
    bat = analogRead(A0); // ->
    bat = ((bat+63) * 1/1023) / (100.1/(100.1+329.5)); // -> We take the reading from adc and turn it into *C -> explanation in instructable
    sensors.requestTemperatures();
    float t = sensors.getTempCByIndex(0); //we store temperature from sensor to variable t
    Blynk.virtualWrite(0, t);//sending temperature on virtual pin 0
    Blynk.virtualWrite(2, bat);//sending battery voltage on virtual pin 2
    ESP.deepSleep(900000000);//board enters deep sleep for 15min (number is in microseconds)

    delay(100);
}
Is that DS18B20 sensor you have? Does graph show V2 pin?
Sorry for beeing unclear, but yes, I’m using Ds18b20 and that graph represents v0 that is temperature as v2 is battery voltage. You can see all those spikes of data. They might be from the sensor, but I don’t know. Here is my csv file for temperature and, if you have time, you can see the problem of the time having different 0s or is that just my problem in latest excel…
https://mega.nz/#!vhsgEQTY!BDNrmaTQtSGkgmoGksyJDO1kkzvVxeEpCbj4z-K0aXE