Data Storage ideas needed!

Hey Blynkers!

It’s time to store your sensor data! What I would like to understand is what you, Blynkers, expect to see as output of data storage. Please share your real use cases, tell me what data are you interested in, what is most important for you at the moment. Based on your ideas I’ll implement it.

Good to have this discussion…

In my case I would be happy to have raw data stored as a CSV for instance. I will have to temperature, humidity and light level (being 0 or 1, threshold can be defined on sensor).

Something like

PIN1, timestamp, 1
PIN2, timestamp, 123
PIN3, timestamp, 0
PIN1, timestamp, 0
PIN2, timestamp, 456
PIN3, timestamp, 0
DISCONNECTED, timestamp
CONNECTED, timestamp

Where PIN1/3 is a switch or a digital readout and PIN2 is for instance the temp or some other value.

  • Timestamps being saved is essential of course.
  • You might think about adding info whether this is incoming input from the app or outgoing data from the controller.
  • Having system status info logged like connects/disconnects or similar might be good in case there’s inconsistent data.

As for averaging and so on: I think that raw data is sufficient. If you are able to grab that you can mess arround with the data in whatever way you want and need. I don’t need blynk to act as some analysing tool - just my oppion of course. Others might look for the usual stuff like

  • average over a time span
  • min/max values

But I think this is not what blynk was made for, at least not with regard to the logging feature. Having this for the graph widget might be nice… but that thing only shows so few data points, that this is not critical as you can get it by just looking at it.

As for the frequency: I’m quite modest here (for the time being). I would log data once per minute. The DHT is slow anyway. But others (and myself for some other project and can’t forsee) will need faster rates… so everything we can get is fine… :wink:

So far I had a play with this code, sorry - in German. Basically it stores DHT-data on the ESP directly and displays it as a webpage and even graphically with the google api. But I’d love to switch to blynk for the logging and skip the graph as I don’t get parts of the code and thus can’t adept it and I’d like to have the option to log other sensor data as well.

Thanks

:smile:

Cool, thanks! Few questions

Do you really think we need to log also data that app sends to hardware? I just do not understand how it could be used.
What about visualization of data on Blynk? Or plain data is enough for you?

For me this is not vital.But image a project, where sensor-data is logged as well as hardware is accessed. You might want to associate, if/why/how sensor data changes due the user interacting with the hardware. Simple example: Logging temperature, controlling humidifer by hand and not via some IFTTT-condition… especially when getting to know the environment this might be good - when you are looking for the right time to activate the humidifier for a large room or so you’d like to know how long it takes after you did something. But as I said: in my eyes this would be a happy lucky extra.

For me raw data would be enough as long as I it is structured somehow (like the example shown above). I’d like to import the data into some chart program and than I can plot and rearrange the hell out of the it. No need to do it within Blynk. There’s enough software out there to manipulate data afterwards, Blynk should be focused on the generation of data / manipulation of hardware - at least for now. There are so many other cool ideas worth considering. :wink:

Ok, accepted =). Also, regarding logging pin. Maybe it would be better to log widget Name instead of it’s pin? Seems it would be more descriptive.

Definitely…! Great idea…

The only case I see for logging data which has to do with hardware could be for debugging purpose. As a use case scenario, I’d like to monitor the temperature of my fishtank. Could also be for a greenhouse or whatever ofcourse.

I agree with @Minc that raw data would be sufficient. Maybe it would be nice to be able to send the output data to second location so I can put it in MRTG for data plotting and making graphs

Ow, one feature request, I’d like to be alerted via a tweet or something when my fishtank gets to hot or cold. Maybe that would be a nice thing to have? :slight_smile:

You already could do that (on Android version) via push notification or twitter. For instance :

if (temp > 50) {
     Blynk.notify("Too hot")
}

Ah, I definitly need to read the rest of the documentation, lol

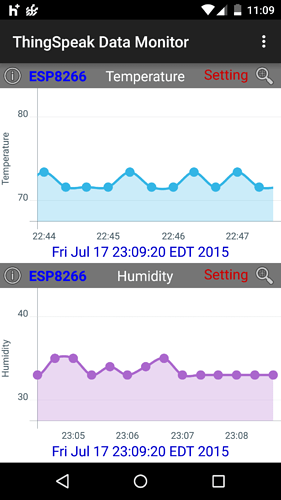
It would be nice if the data could be logged and graphed in blynk. I am using thingspeak right now with a dht11 and esp8266 but It doesn’t seem like a good enough solution. I’d like to see a graph of a whole days activities. I could log csv files and import them into excel but it would be nice to just see it at the click of an app

1 Like

@sel303

When you saying “whole days activities” what time granularity do you mean? minutes/hours/seconds?

I do some monitoring of IT systems and the in that case the granularity depends on the time-frame depicted. For example, if I want to plot CPU usage of a system over the past month, I aggregate the data on a daily basis (the average of that day). For a shorter period I’d like shorter intervals. If I want an hour of data something is probably wrong and I want to take a better look with more data points.

This has to do with, I think, some math and mostly performance. I guess you could make it variable, but performance could be an issue with lots of data.

Hi,

I’m starting to use MQTT + Blynk - just got Mosquitto running on Raspberry Pi.

MQTT then publishes to a Python script that stores the data in SQL.

If Blynk could eliminate the need for publishing from ESP8266 to MQTT as well as Blynking everything it would be great!

Again - raw data for a long period is key. Also the ability to download the raw data easily for long term record keeping and analysis. Maybe provide an MQTT service where one could subscribe to your own datastream for further processing?

Thanks
Nico

Every half hour or so would be fine. Maybe even every 15 min. While also showing the current sensor values, which blynk already does very well.


This is what I did with thingspeak, the esp8266 and dht11. I need to fiddle with the code a little, it posts data a little too often.

Edit: Even if the data was stored locally on a SD card in CSV file and bynk could access it to avoid having to store the data on your end. I’d like to be able to check logs from a week ago to compare.

1 Like

Ok guys. Thank you all for ideas. Will implement something based on that.

@Minc
For now, for those of you who using local server you can take latest server version that stores simple raw data in csv.

Some doc could be find here.

1 Like

This is great news @Dmitriy! Looking forward to test this as soon as I get a chance - most likely tomorrow. :slight_smile:

1 Like

I would just like to see a history in the graph when open the blink app. Currently when I open the app the graph starts with the current data being pushed.

My project is a simple temperature monitor I might add humidity and a power monitor. If I receive a text or email alerting me to a Max temperature, I would like to be able to open Blink app and see some history on the bar graph to see how long the area has been over temp and what was the rate of temp climb.

I have access to both IOs and android and notice android has the ability to email and tweet. Could this be done from storage so when the data hit a minimum or maximum it would be sent even when the application is not open? I believe this would also allow both platforms the ability to send alerts on data triggers.

1 Like

What is the current state of this? I would like to be able to see history of when app is not open. I know server keeps this data, when will it get to app on android?

@CptanPanic It’s a question of 1-2-3 days. All is done and tested. Final review and preparing for deployment.

@Minc, @Lichtsignaal, @sel303, @nvddussen, @kirkh2o, @CptanPanic, dear all we just released history graph for Android. Check it out and tell us what you think.