Hi.
I’m running my first project using Blynk on a local server.
Really nice system, however I’m experiencing some issues with some widgets on the Android App.
I suspect that at least a part of them may be due to some mistakes on my server configuration, but I can’t figure out what’s wrong. The reason I’m not suspecting the firmware on the device is that Value Display widgets work fine, so it looks like variables are correctly sent to the server.
My setup:
I’m using “device1” to monitor density of homebrew beer during fermentation (Plato degrees). This device sends sensors data (temperature, battery level, tilt angle) to Ubidots every 15 minutes. Ubidots calculates Plato value as a derived variable. Then I have “device2” (Wemos D1 mini+LCD display) that reads the four variables from Ubidots, shows them on a LCD display, then sends them to my local Blynk server by PUSH method (ok, I could have made everything in a simpler way, but the firmware on device1 currently only supports Ubidots, and I just wanted to experiment with Blynk…).
Then I have Blynk app on my smarphone, with some widgets to show how the process is going. I’m only using virtual pins at the moment.
The fermentation process began about ten days ago, with Plato values starting from 19 and now being at 2.6 (or so).
This setup has uninterruptedly worked quite well in these days, Ubidots and Blynk data look aligned, with only some occasional missing samples due to me tinkering with my new wifi repeater…
The only small issues I’m having, are with some widgets not showing what I expect.
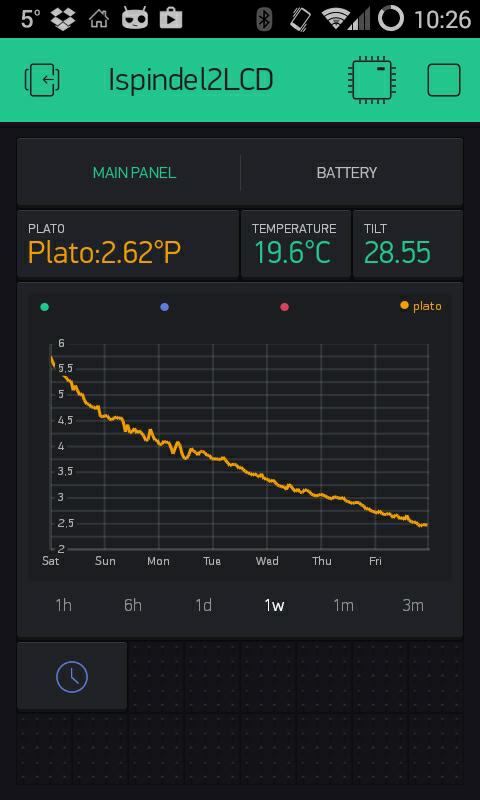
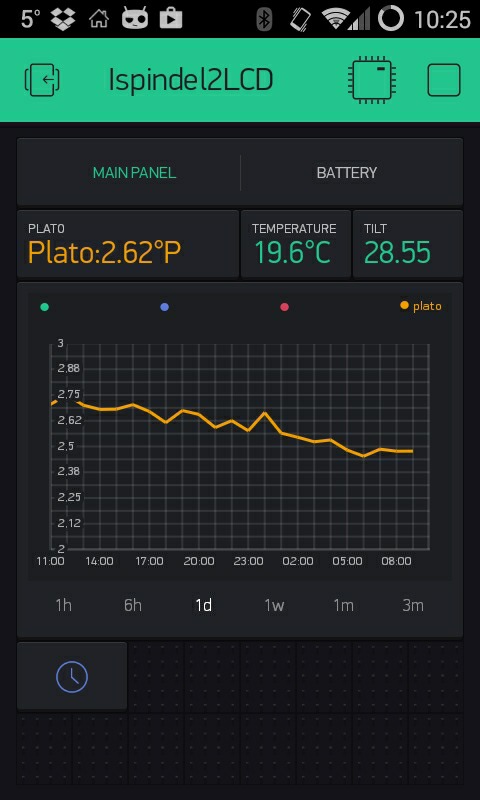
1. History Graph
Auto-scaling of Y axys doesn’t seem to work properly for some time scales.
The graph obtained using the 1Week scale looks nice
However the graphs with 1 Month and 3 Months scales don’t look as nice…
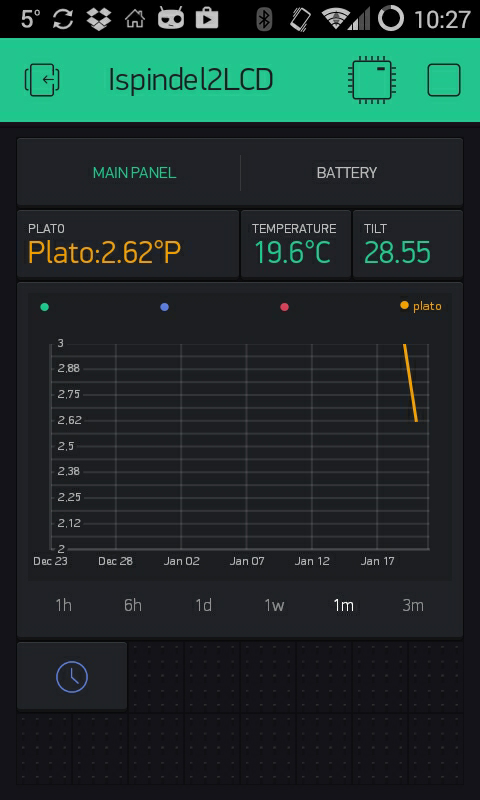
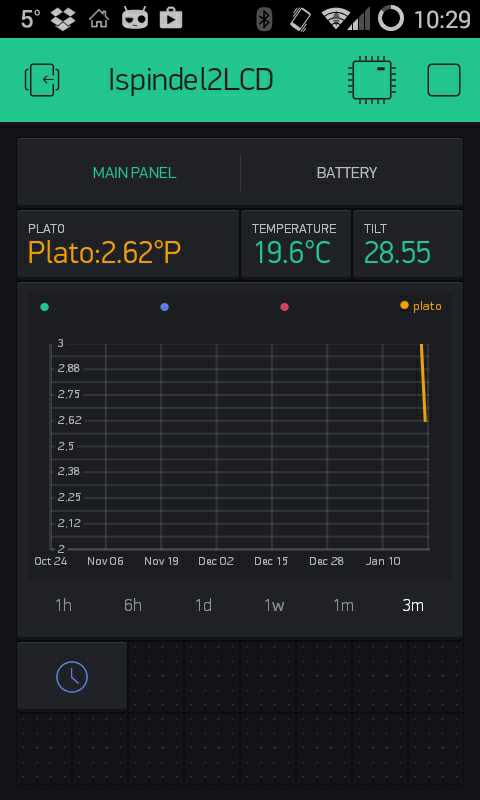
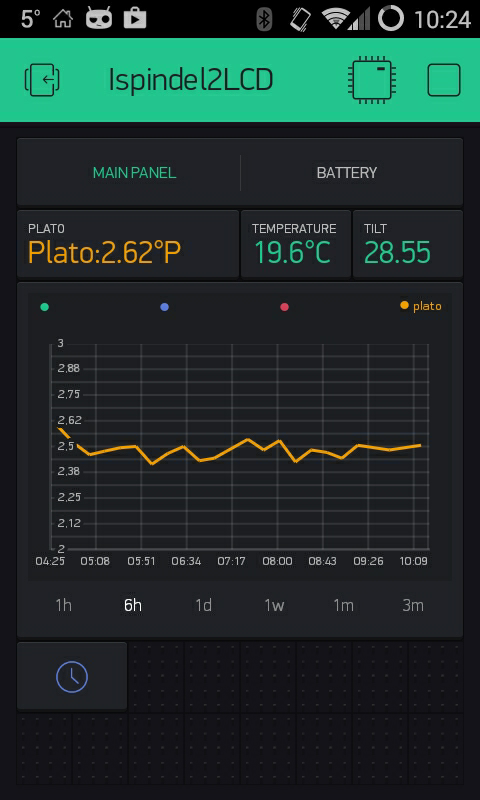
Here I would expect an Y axys range of 2-20 (or so). The usage of 2 and 3 as lowest and highest values in Y axys looks wrong, not sure if it is someway related, but it is the same range (correctly) chosen for 6 Hours and 1 Day scales.
(Another possible issue, not relevant here, is that apparentely the app chooses integer numbers as minimum and maximum values for Y scale, so, for example, if the variable to be monitored had values going from 0.01 to 0.02, I guess Blynk would choose 0 and 1 as the min and max Y scale values, so you would always see a flat line, that is not what you want to see…).
2. RTC Widget
It is not working. You can see it at the bottom left of previous images. SInce it is supposed to show server time, may it be related to something that I need to configure on my local server ?
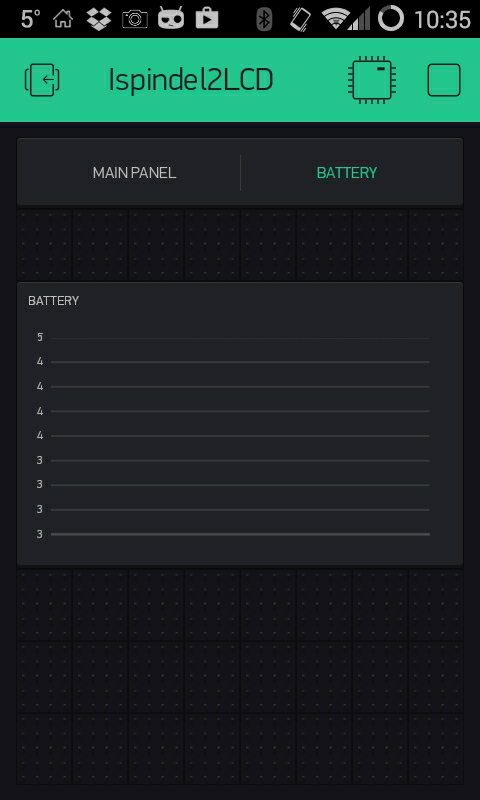
3. Graph/Gauge/Level widgets
Not working well/not working at all . A server side issue?
The graph is blank. I patiently waited the arrival of data from the server, but the graph still remained blank.
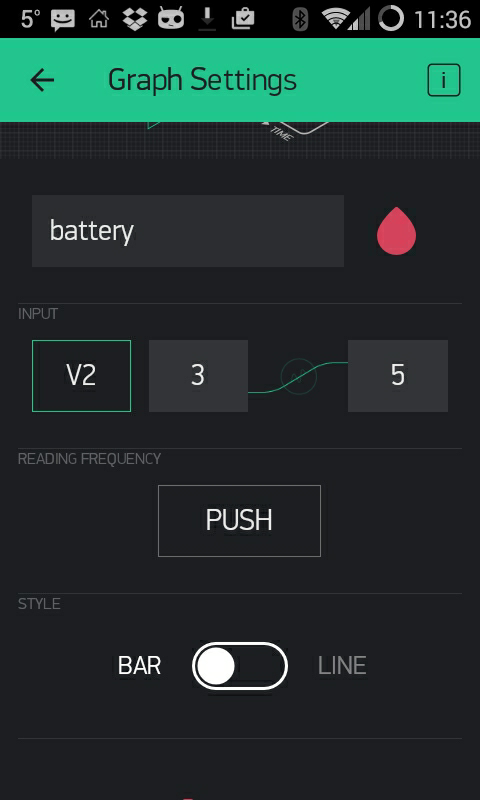
This is the way I configured it
The same V2 variable, referenced in a Gauge widget, sometimes seems to work fine…
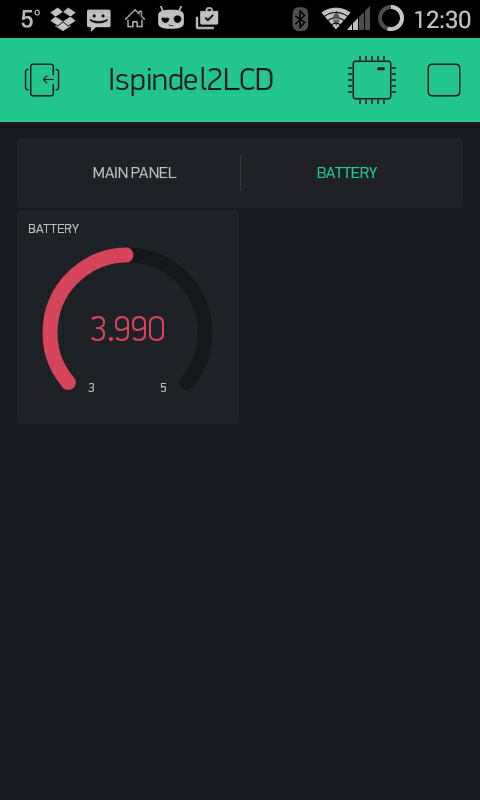
… sometimes not ( reset to 0)
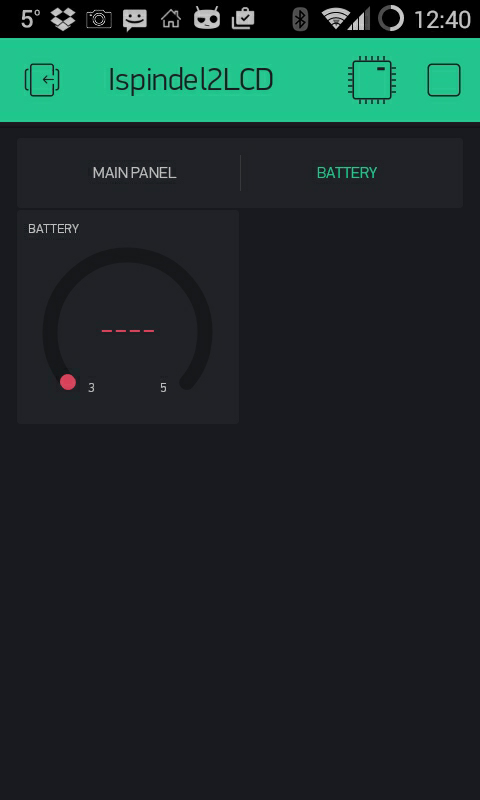
Didn’t dig much into it, but apparentely this behaviour seems to be someway related to android screen update.
Just after data update on Blynk server, the app displays the widget correctly, after some time the android screen blanks (as it is expected to do) then when I turn the screen on, I briefly see the green dots moving around (updating view, I believe), then the widget is shown as reset to 0. It stay this way until next variable update from the server). Level widget behaves the same way.
4. Variable selection
Well, this is not properly an issue, but I would be curious to know why it is not possible to reference the same variable in two or more widgets (used variables are shown as “BUSY” and I can’t select them). For example, I could want to report the value of a variable as a Value Display widget in one tab, and have the same variable seen as a gauge widget on another tab. Or I may want to see a Gauge AND a Graph.
However I see that there is an exception, in the History Graph you can select any variable regardeless if it was already used in another widget. So I wonder which is the purpose of this limitation on other widgets…
Sorry for the long post. Any hint?