I am using a Superchart to plot an airconditioner’s evaporator temperature and the compressor current. Working great !
Hardware used is a ESP32. The blynk Timer is set to push data ( DegC & Amps) once every 10 seconds.
I recently left it running for about 7 hours. Then I exported the data and got it via my Mail ID. When I opened I found the following
- I got two files - one for each channel.
- The number of records was very low - only 808 records in each. Whereas I should have got 7 hr x 60 minutes x 6 records = 2520. Not sure what happened to the rest.
- I think the date/time stamp is a Epoch type. When i use this formula (millisValue*0.001/86400+DATE(1970,1,1) to decode it in Excel I get values which do not exactly tally with the actual time frame…
Kindly help to understand this and whether my expectation is right ??
Thanks
I’m surprised you received 808 records, I would have expected more like 402 records.
The maximum granularity of the database behind Superchart is 1 minute. Any data values received during a 1 minute period are averaged, and the result written to the database.
So that’s 60 records per hour and 7 hours would give 420 records per virtual pin.
Also beware than when using the cloud servers, although the historical data is visible in SuperChart for long periods of time (I have some going back two and a half years), you can only export a limited amount of this. It’s usually about the last 10 days worth of data.
Pete.
Thanks for the update on the granularity of the exported records. Will plan accordingly in future. I was actually planning to use this like a ThingSpeak server where it captures all data being sent but of course it kicks out any data less than 15 second interval !
So that also explains the deviation in the actual time frame to the recorded time frame that i notice ? For instance in this case i logged from about 9.30PM on 29 June to 0730AM on 30 June. The records stopped much earlier than 0730.??
I’m not sure without you quantifying what “much earlier” means and being more specific about the deviations.
The documentation about granularity is at the end of the SuperChart section of the documentation:
https://docs.blynk.cc/#widgets-displays-superchart
Pete.
Hello Pete ! Thanks for the advice.
Yesterday I revised the timer to fire once in 60 sec and ran it for about 9 Hrs + overnight. Now the number of records tally ( 635 records ) but what is not tallying is the actual time frame… while I am writing this I get a doubt . Should I account for the GMT+5.30 Hrs ??
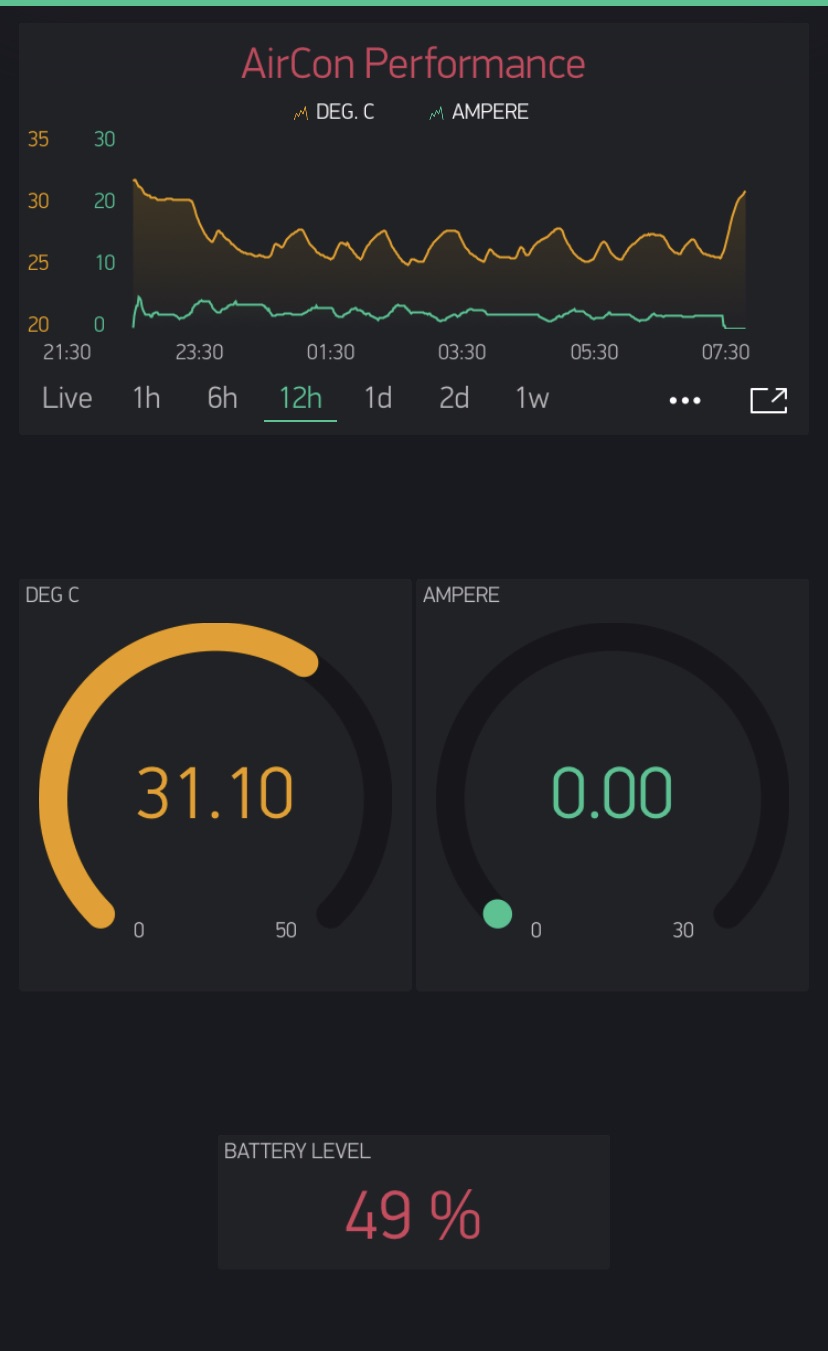
If so how to do that ? I am attaching the Blynk App screen shot. The corresponding converted XLSX file has records from 29/June/20 : 13.55 Hrs to 30/June/20 : 02.19 Hrs. ( as per local time plot was started around 21.30Hrs yesterday and stopped at 07.45 Hrs today )
Thanks again for your continued support.
When Superchart displays data on your phone, the times shown at the bottom use the timezone of your phone (you can try this by changing your timezone). I find this a little odd when I have a device logging temperature and brightness in Europe than view the data in Thailand. It shows that maximum outdoor temperature and brightness was at a time before it was even light in Europe 
Obviously, when you’ve realised what’s happening it’s easy enough to interpret the data.
The UNIX times are in GMT/UTC time zone, so need to be converted
The Excel formula I use is:
=(((B1/1000)+(1*3600))/86400)+(DATEVALUE("1970-01-01") - DATEVALUE("1900-01-01"))
This part:
+(1*3600) adds 1 Hour to the time to convert from GMT to British Summer Time. In your case that would probably need to be +(5.5*3600) as you are five and a half hours ahead of GMT.
Pete.
Perfect… all well !!
And just out of curiosity : Excel uses the starting date as 1-1-1900 and that being the case why does it expect us to subtract the DATEVALUE(“1900-01-01”) to arrive at the right date ?
Thanks Pete !
Excel uses 01/01/1900 as it’s base date (date zero) whereas Unix uses 01/01/1970 as its’s base date.
Pete.