Hey there!
We’ve started using Blynk yesterday and it is really awesome. However, there are two things I have noticed.
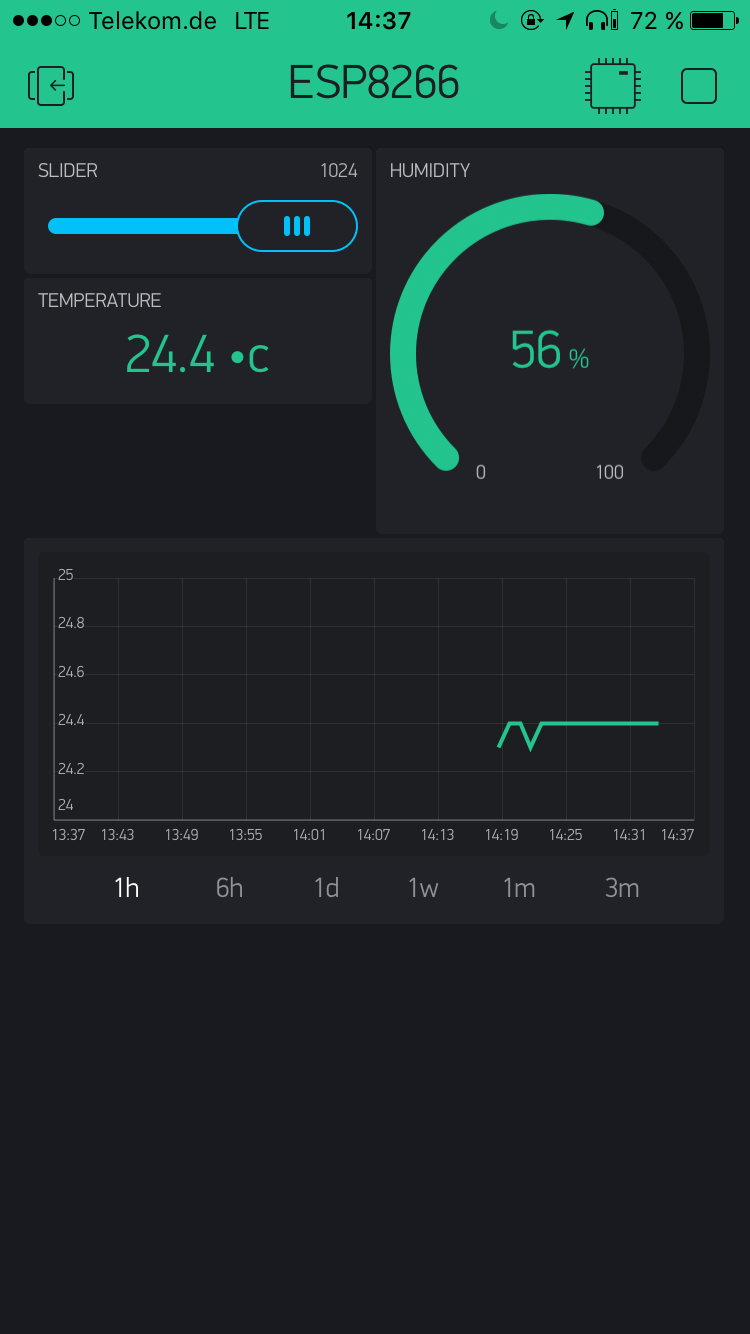
1: When adding a slider, the order of the “from” and “to” values of the PWM setting are disregarded.
I experimentally bound the builtin LED of my Wemos D1 Esp8266 board to a Blynk slider.
At the D1, a pulling the pin HIGH disables the LED, pulling the pin LOW enables the LED.
Within the slider configuration I can now set ranges for the PWM from 0 to 1023. Now the issue is that the LED is off when the value is at 1023 but on when the slider is at 0. I just reversed the input, ranging from 1023 to 0 but the issue still persists, the LED gradually turns on if I set the slider to 0.
So either I was unable to configure my setup correctly or your App is doing some magic and sorting the input values somehow unpredictably 
The second issue I have experienced is, that the graph in a “History Graph” module is not show values continuously but cuts off values, although I am certain that I have measured data at that time. To me it looks like that the graph is stuck when the value of the data point has not changed over time, i.e. the graph library draws the last point where a value change occured and does not continue drawing the line until t-0.
Screenshots attached
Cheers