I also have observed the SuperChart binary stream shadow issue described here and been following this thread for a while. I now can reproduce it and then fix it without modifying my device code on my ESP8266. Here is how:
Starting with a SuperChart on project A with 4 binary streams each correctly occupying a seperate 25% of the graph area.
Switch to project B on the Blynk mobile app and then switch back to project A. Now project A SuperChart has 1 binary stream w/ a shadow from 0-25%, 1 from 0-50%, 1 from 0-75%, and 1 from 0-100%.
Then pick a datastream and change its style “style bar”. Run (press the play) and observer the shadow are now correct for the remaining 3 binary styles.
Finally, re-edit and return the SuperChart widget datastream on project A back to “style binary”
Again, this break and fix did not require a code change. Sorry, my code is not shareable. I hope this helps. Since I recently registered, I’m limited to only 1 screen upload so this is the screen shot after step 3.
No need to group tag users who are already part of a topic… besides, two of the three are NOT developers anyhow… well, at least I for sure am not
Meanwhile… after 7 months of updates (you are updating the App, right?)… are you still seeing this issue?? If not, then yes it was solved… if so, then no it was not
Hi, the library we use for drawing these charts updates and these updates bring issues with some charts, as we have heavily customized it. I will look again into this issue.
Hi, may you provide some details about this issue on your device: your device’s model and android os versions. And also on which exactly chart set up it reproduces. I can’t reproduce this issue for binary and other charts I tried on Android 10/11 devices - I will later try to check older Android versions.
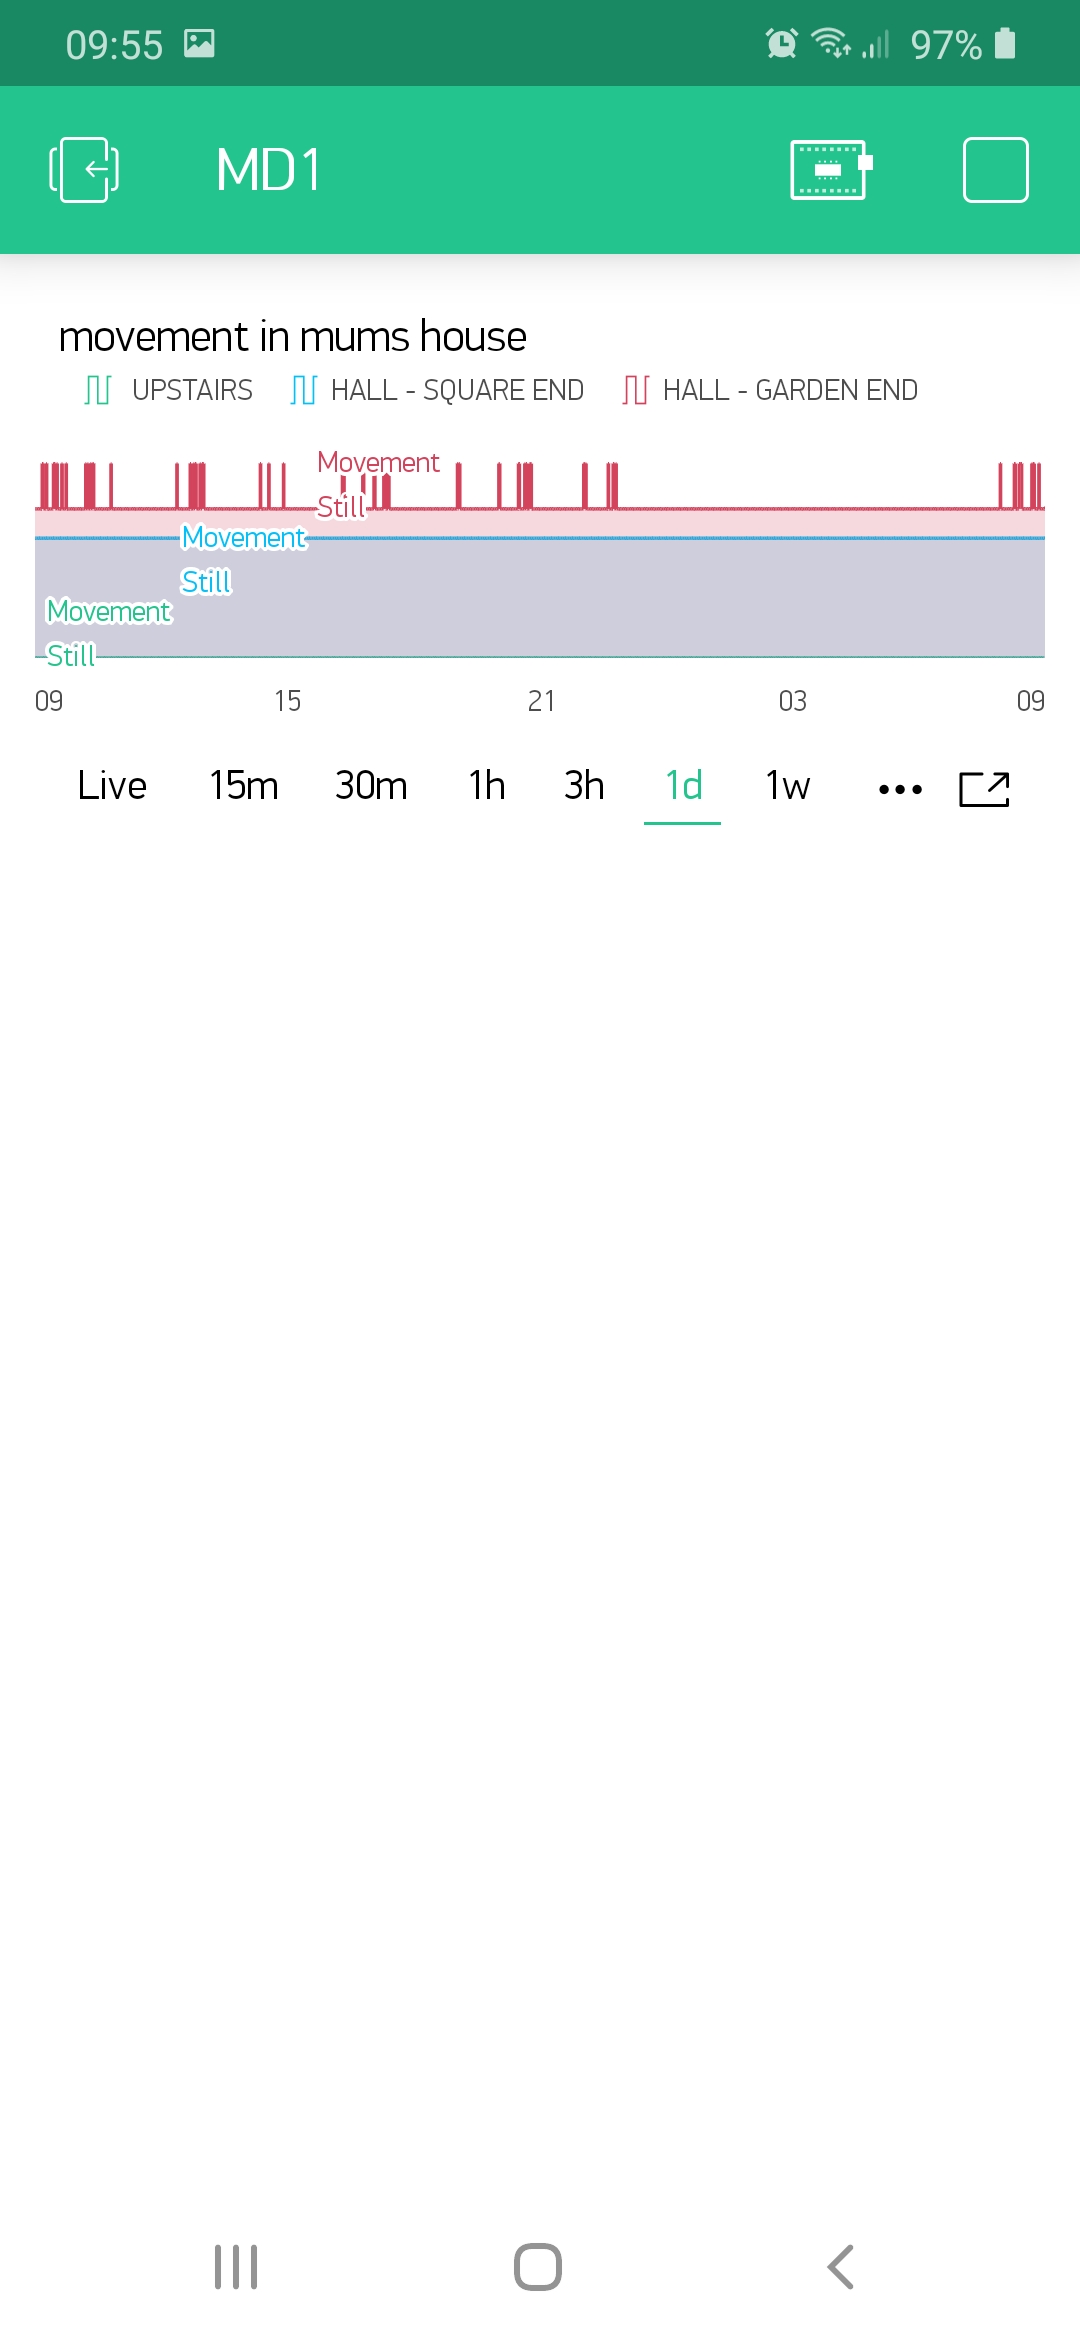
Hi. My phone is a Samsung Galaxy A40, Android version 10.
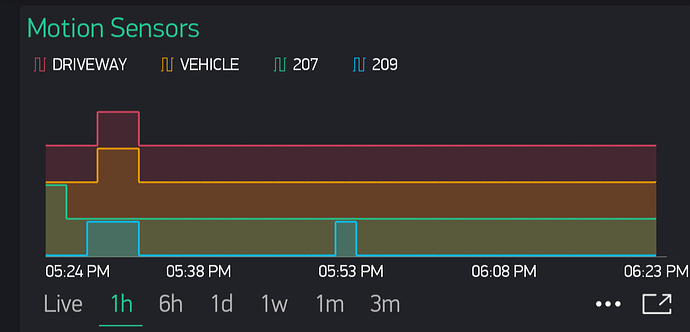
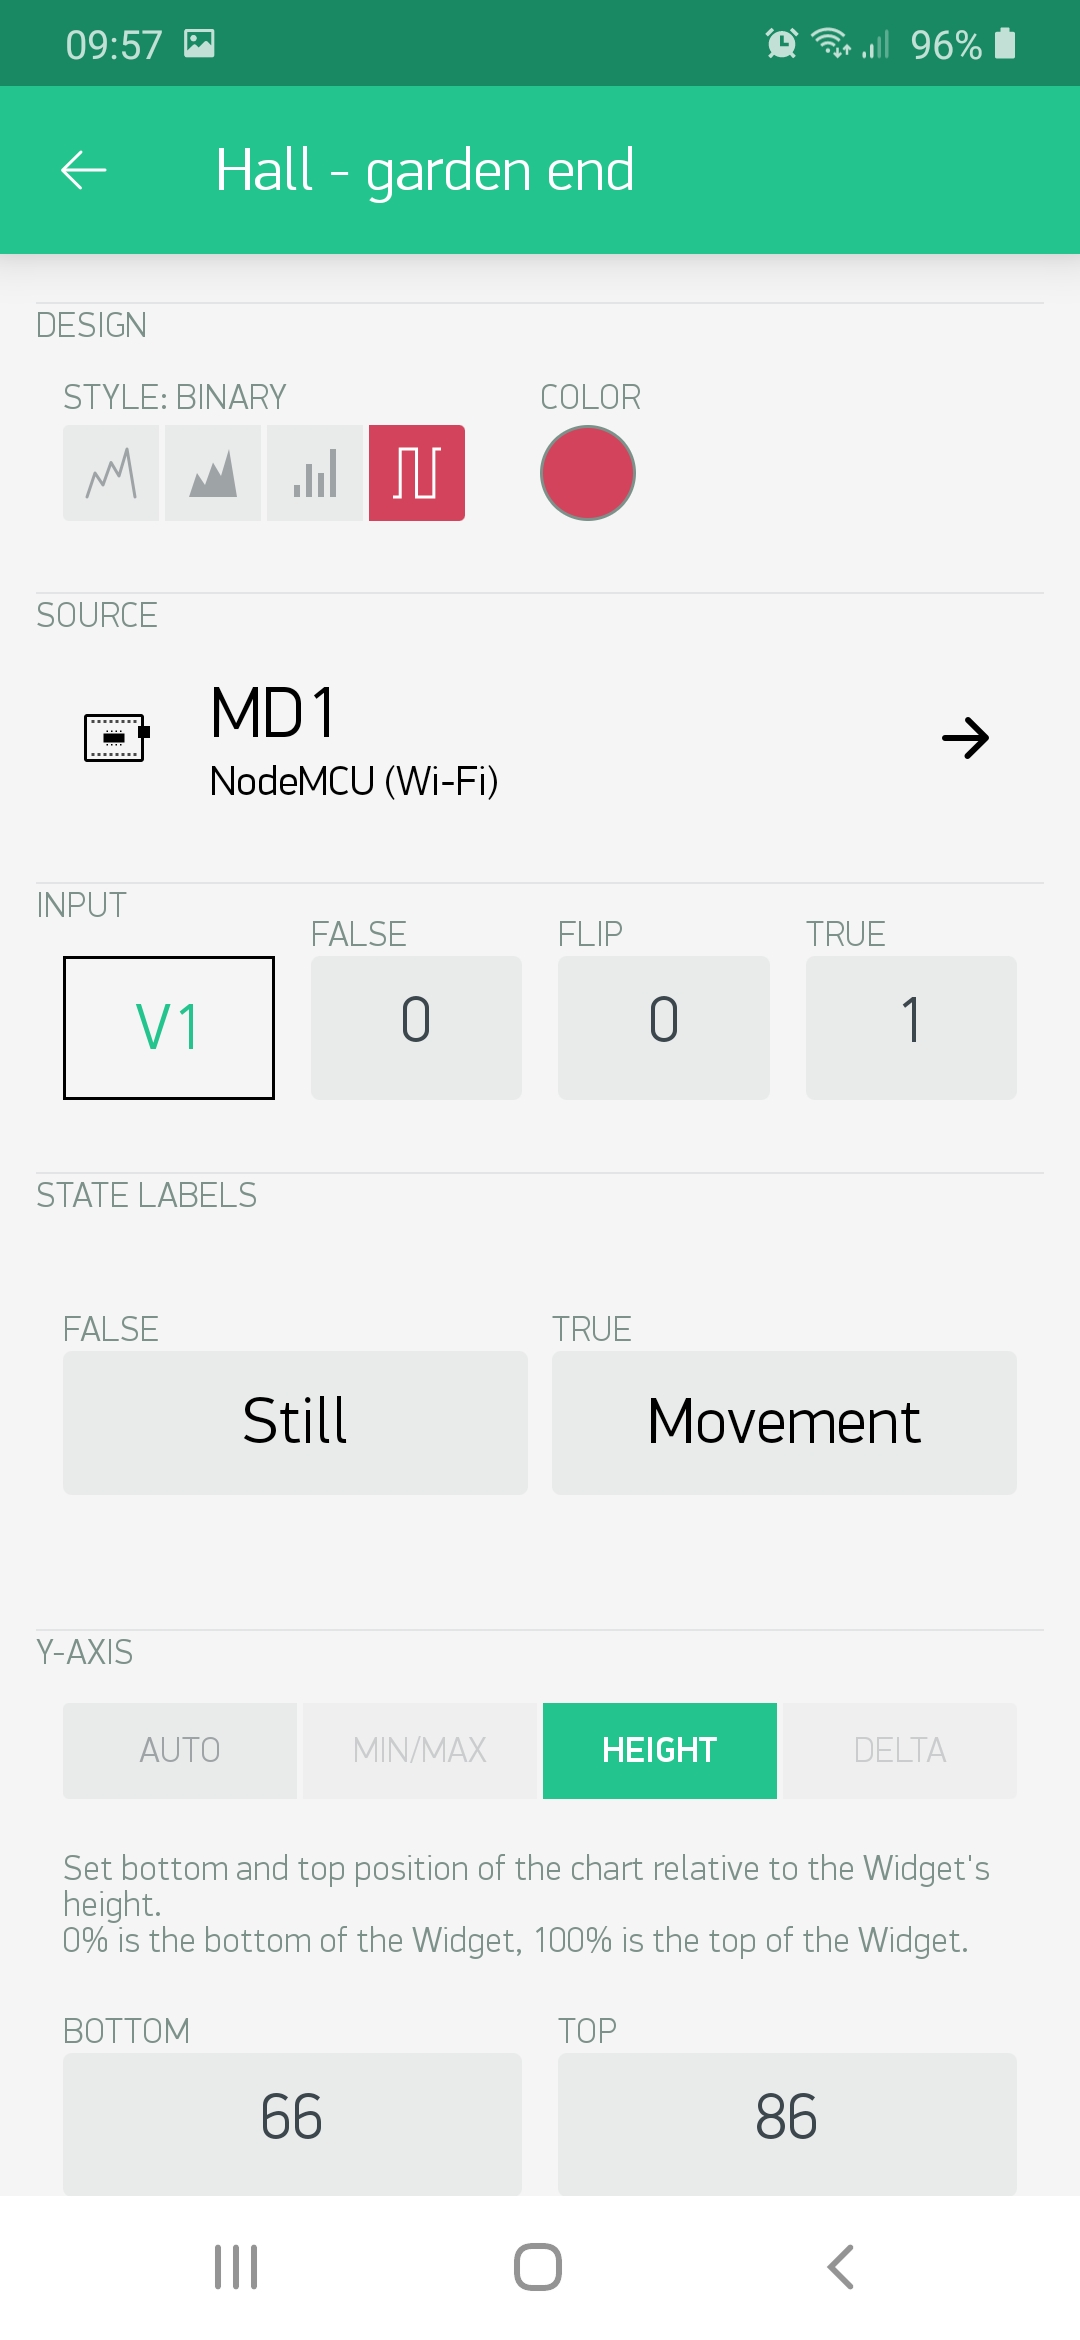
Here is the view on my phone. There is only 1 of 3 PIR sensors connected at the moment but the undesirable effect is still clear. The red trace shows up well because its not being drawn on top of any other fill. For some reason the blue trace is showing a value of 1 and the green trace shows a value of 0.
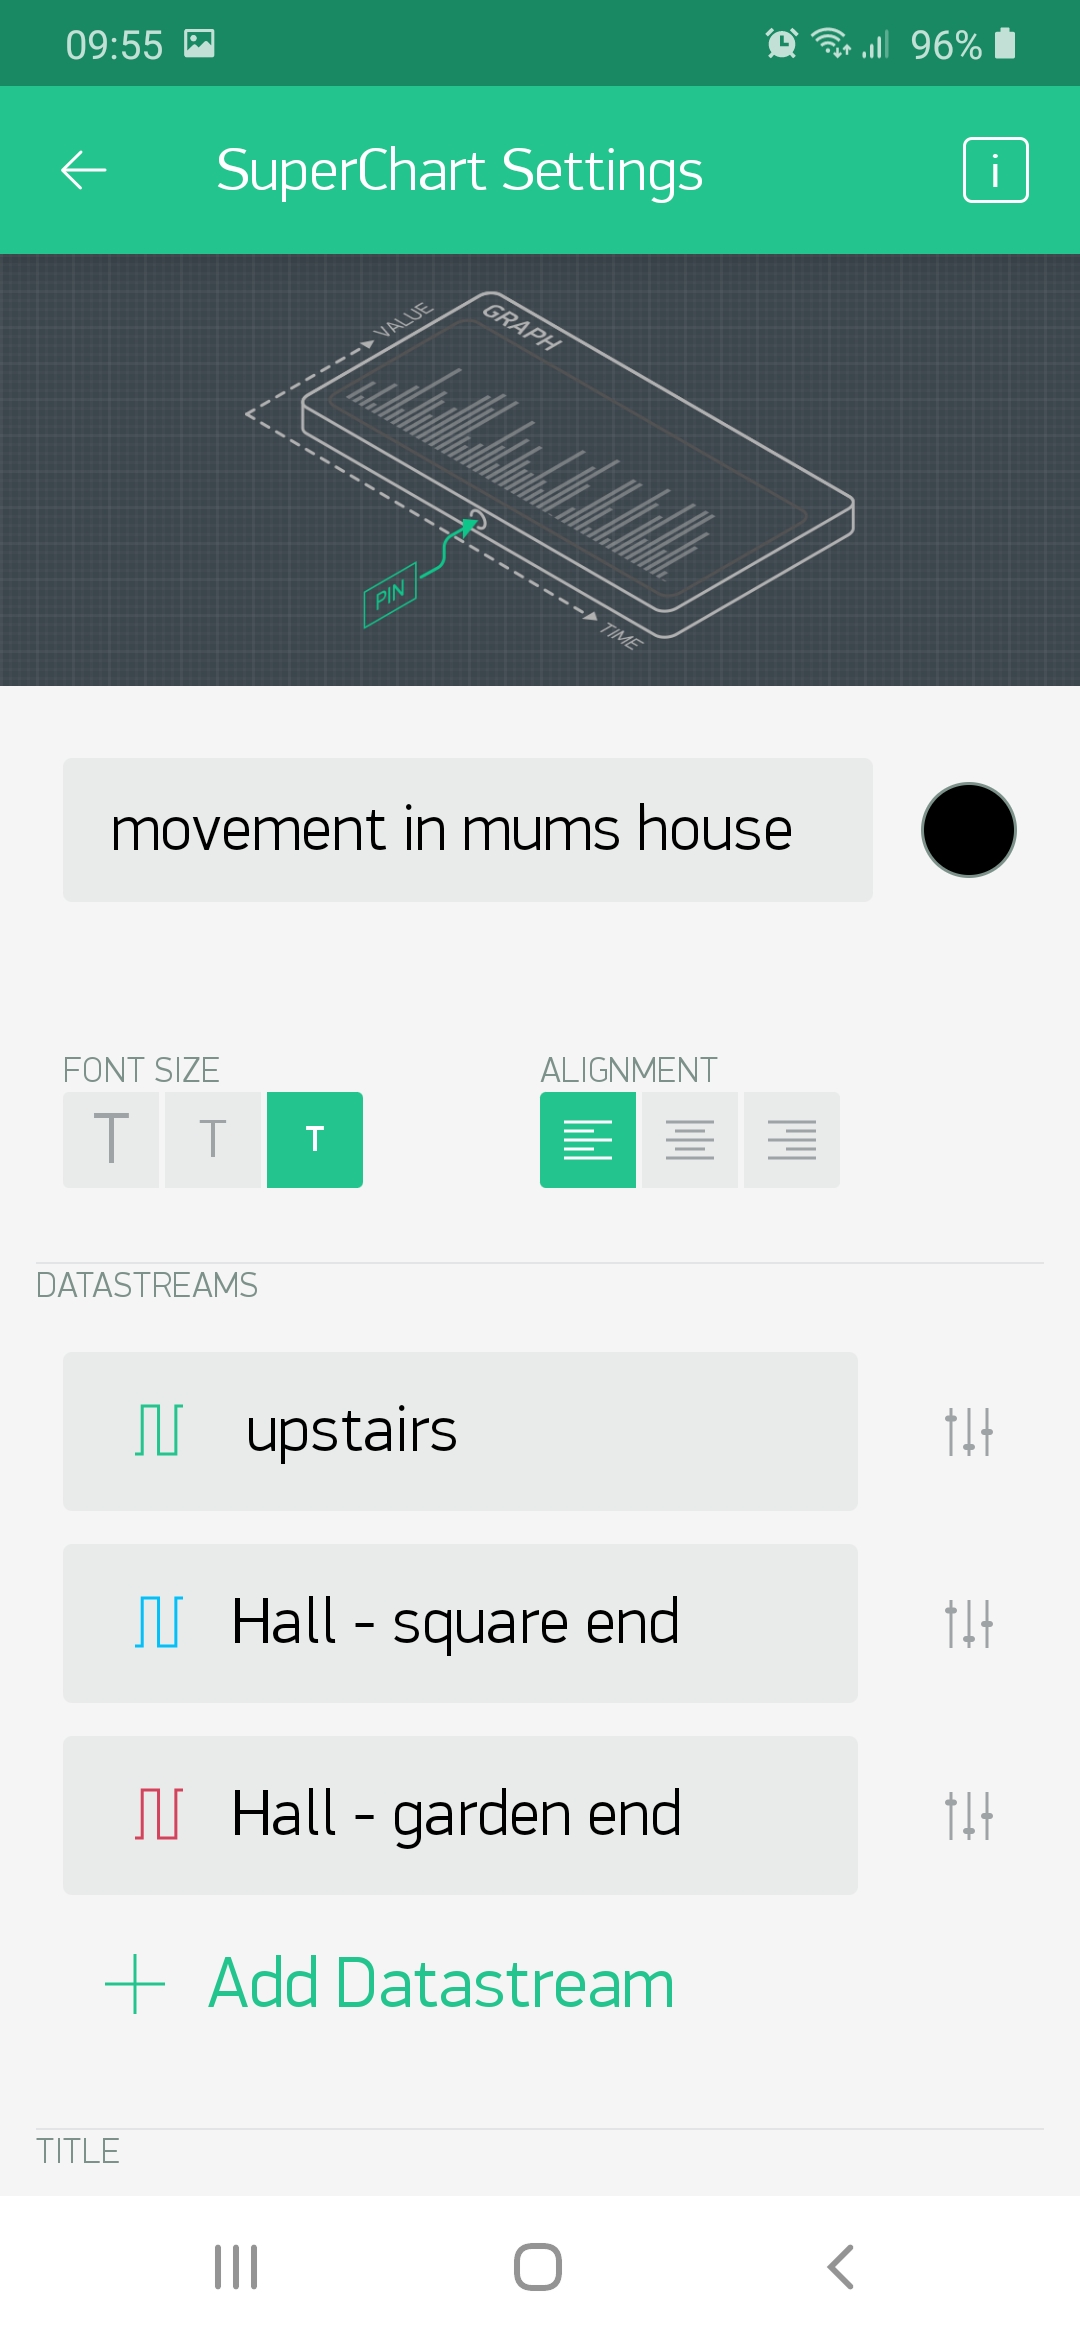
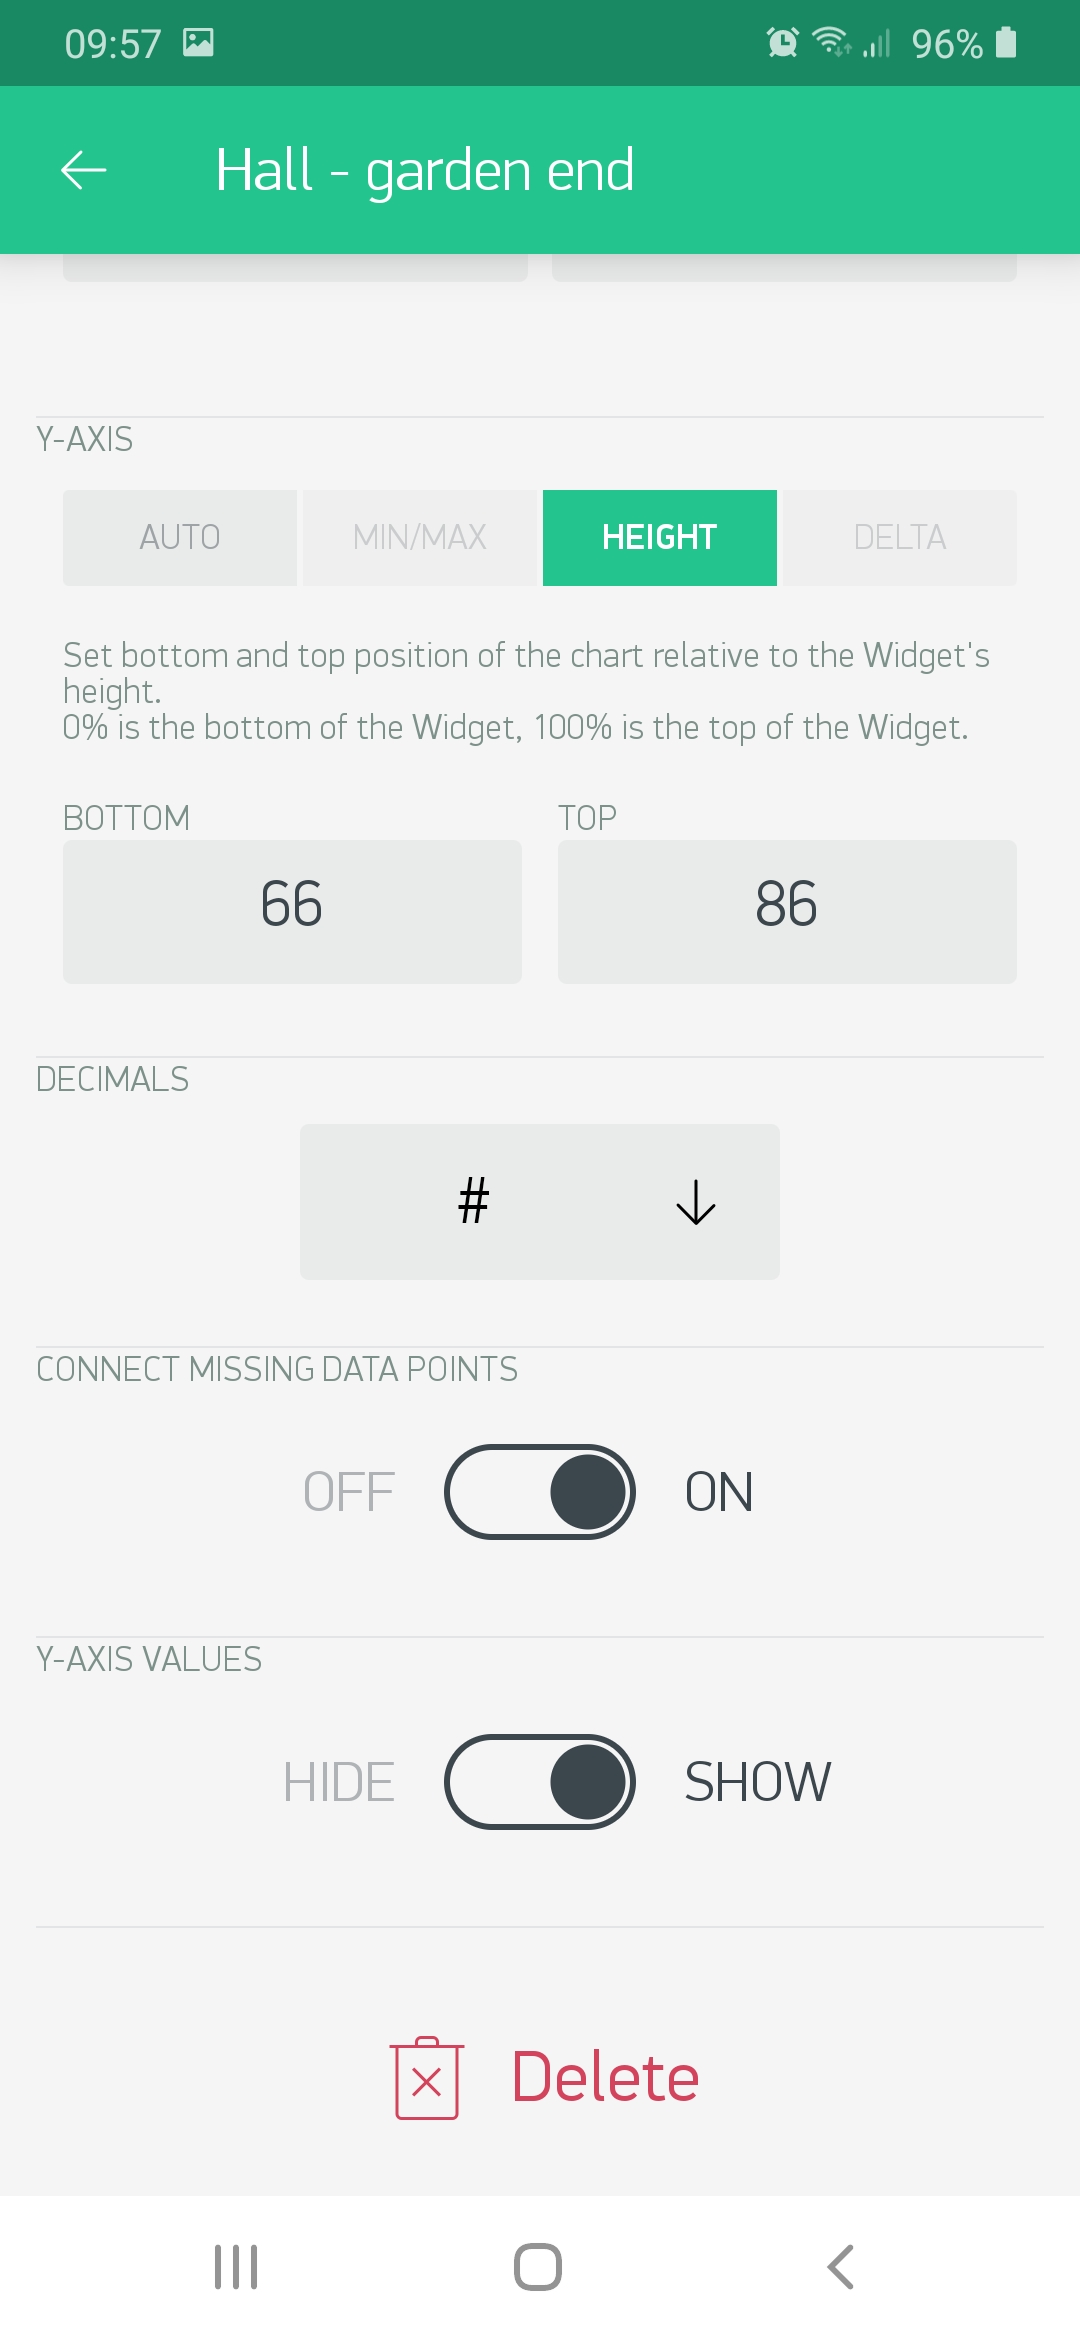
Do the other data streams have the same setup, but with different height’s top and bottom?
false = 0, flip = 0, true = 1 - is a correct set up for such case. If you have false = 0, flip = 1, true = 1 it will lead to a case of the green stream when it is always at false.