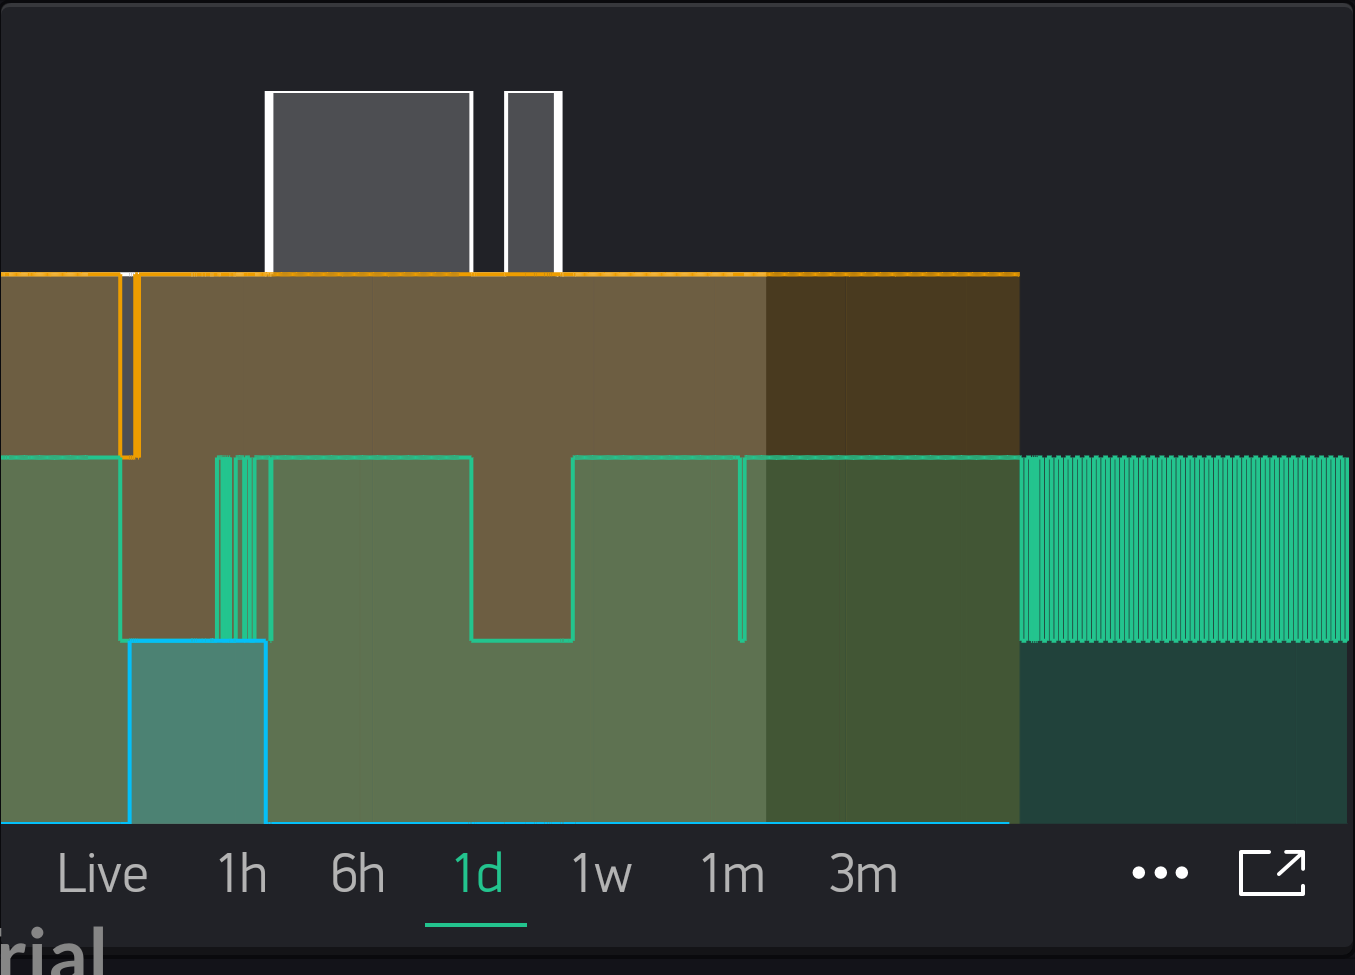
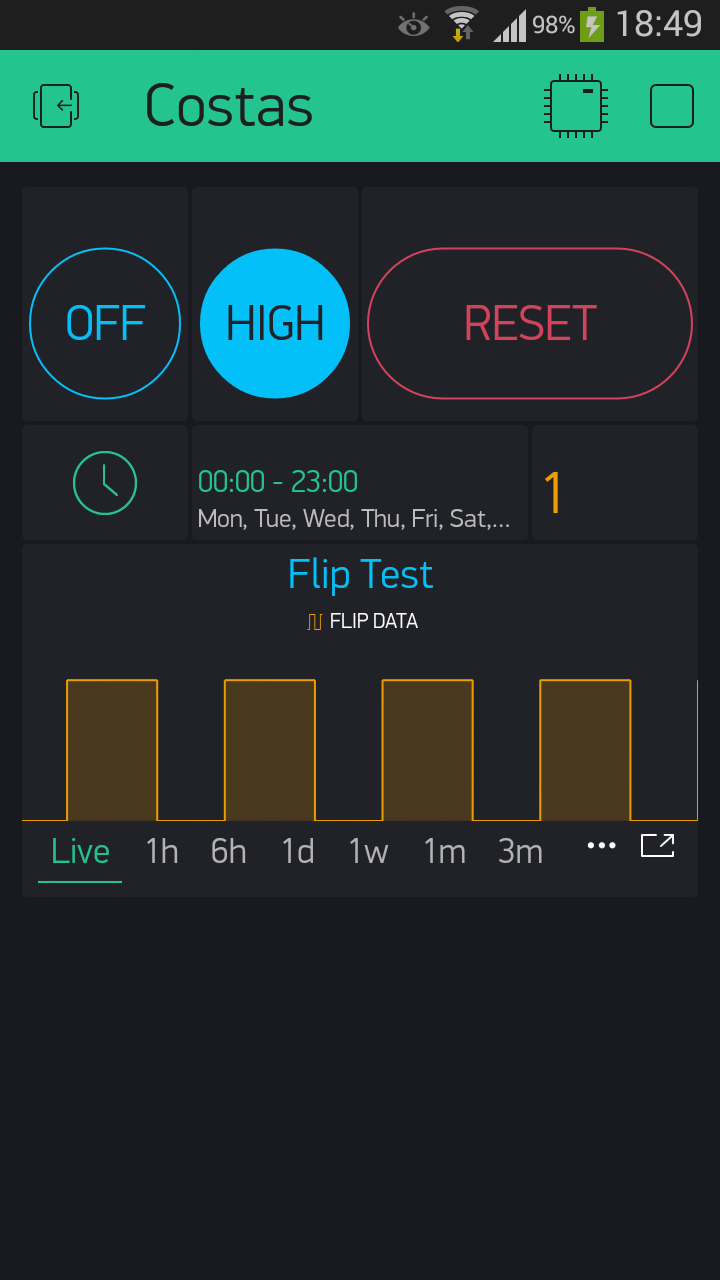
The lines are drawn correctly but unfortunately all of the streams constantly draw their shadow to 0 value (it doesn’t matter if the stream value is 0 or 1)
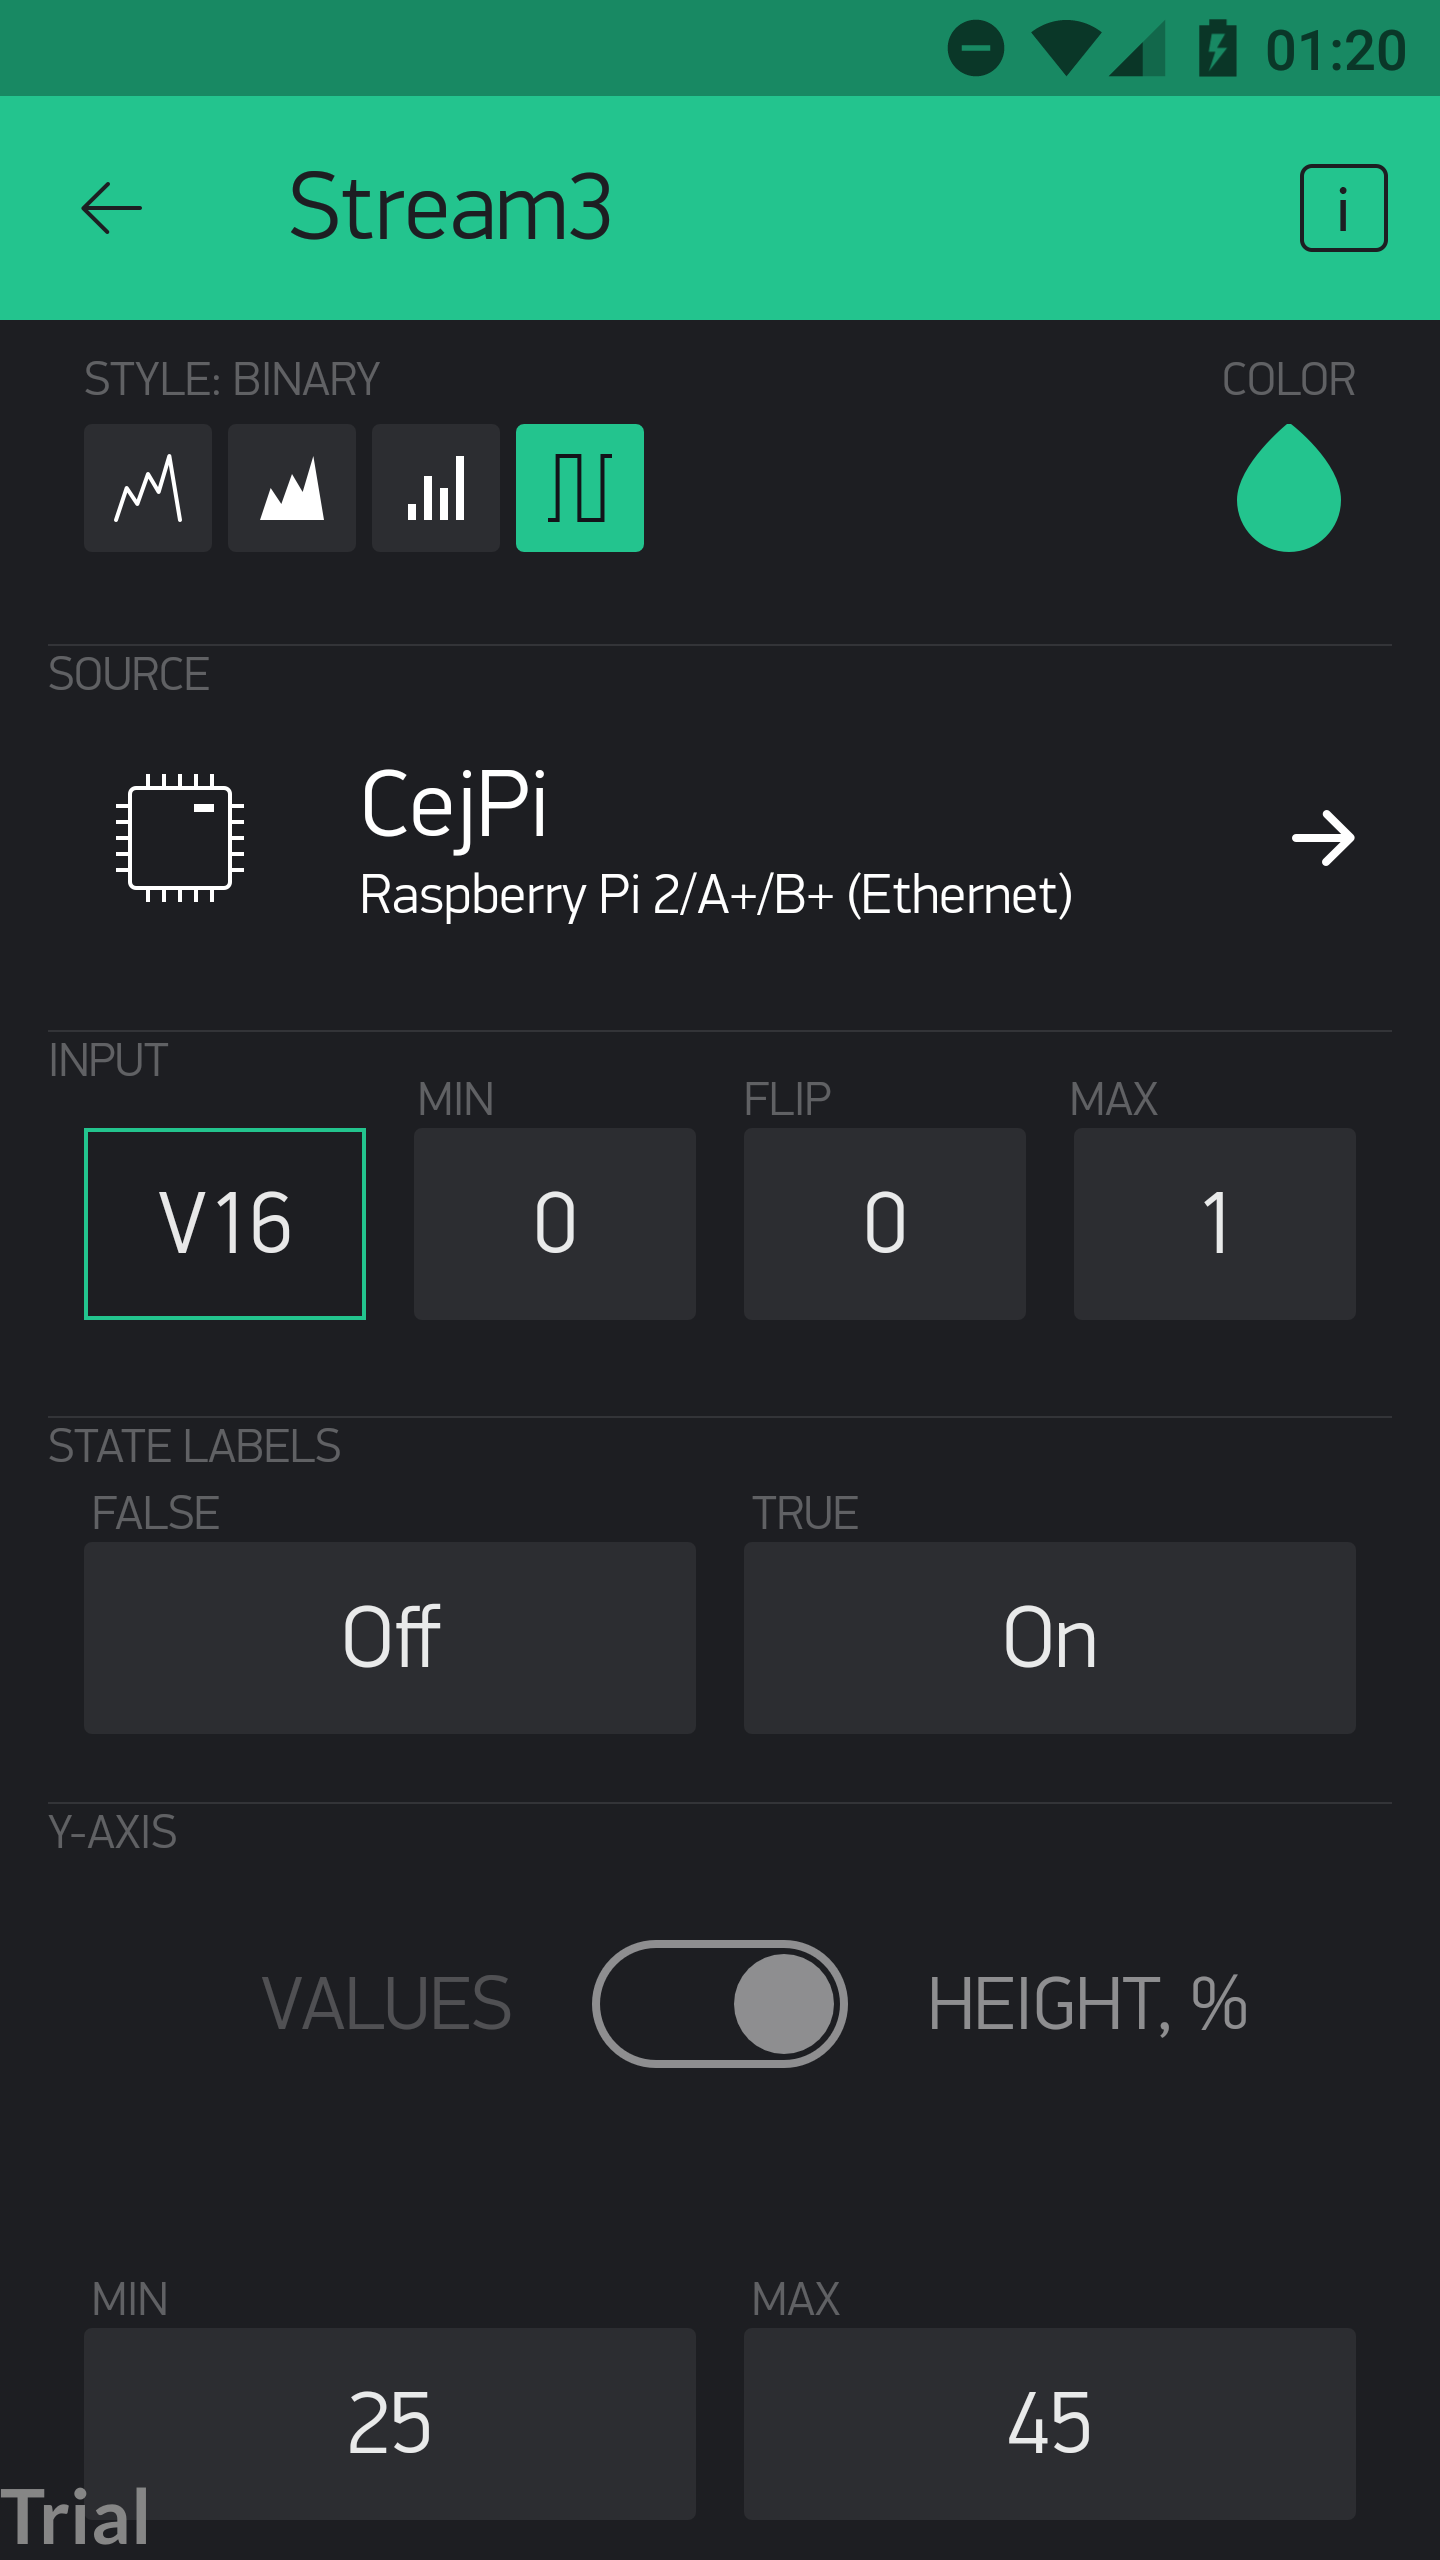
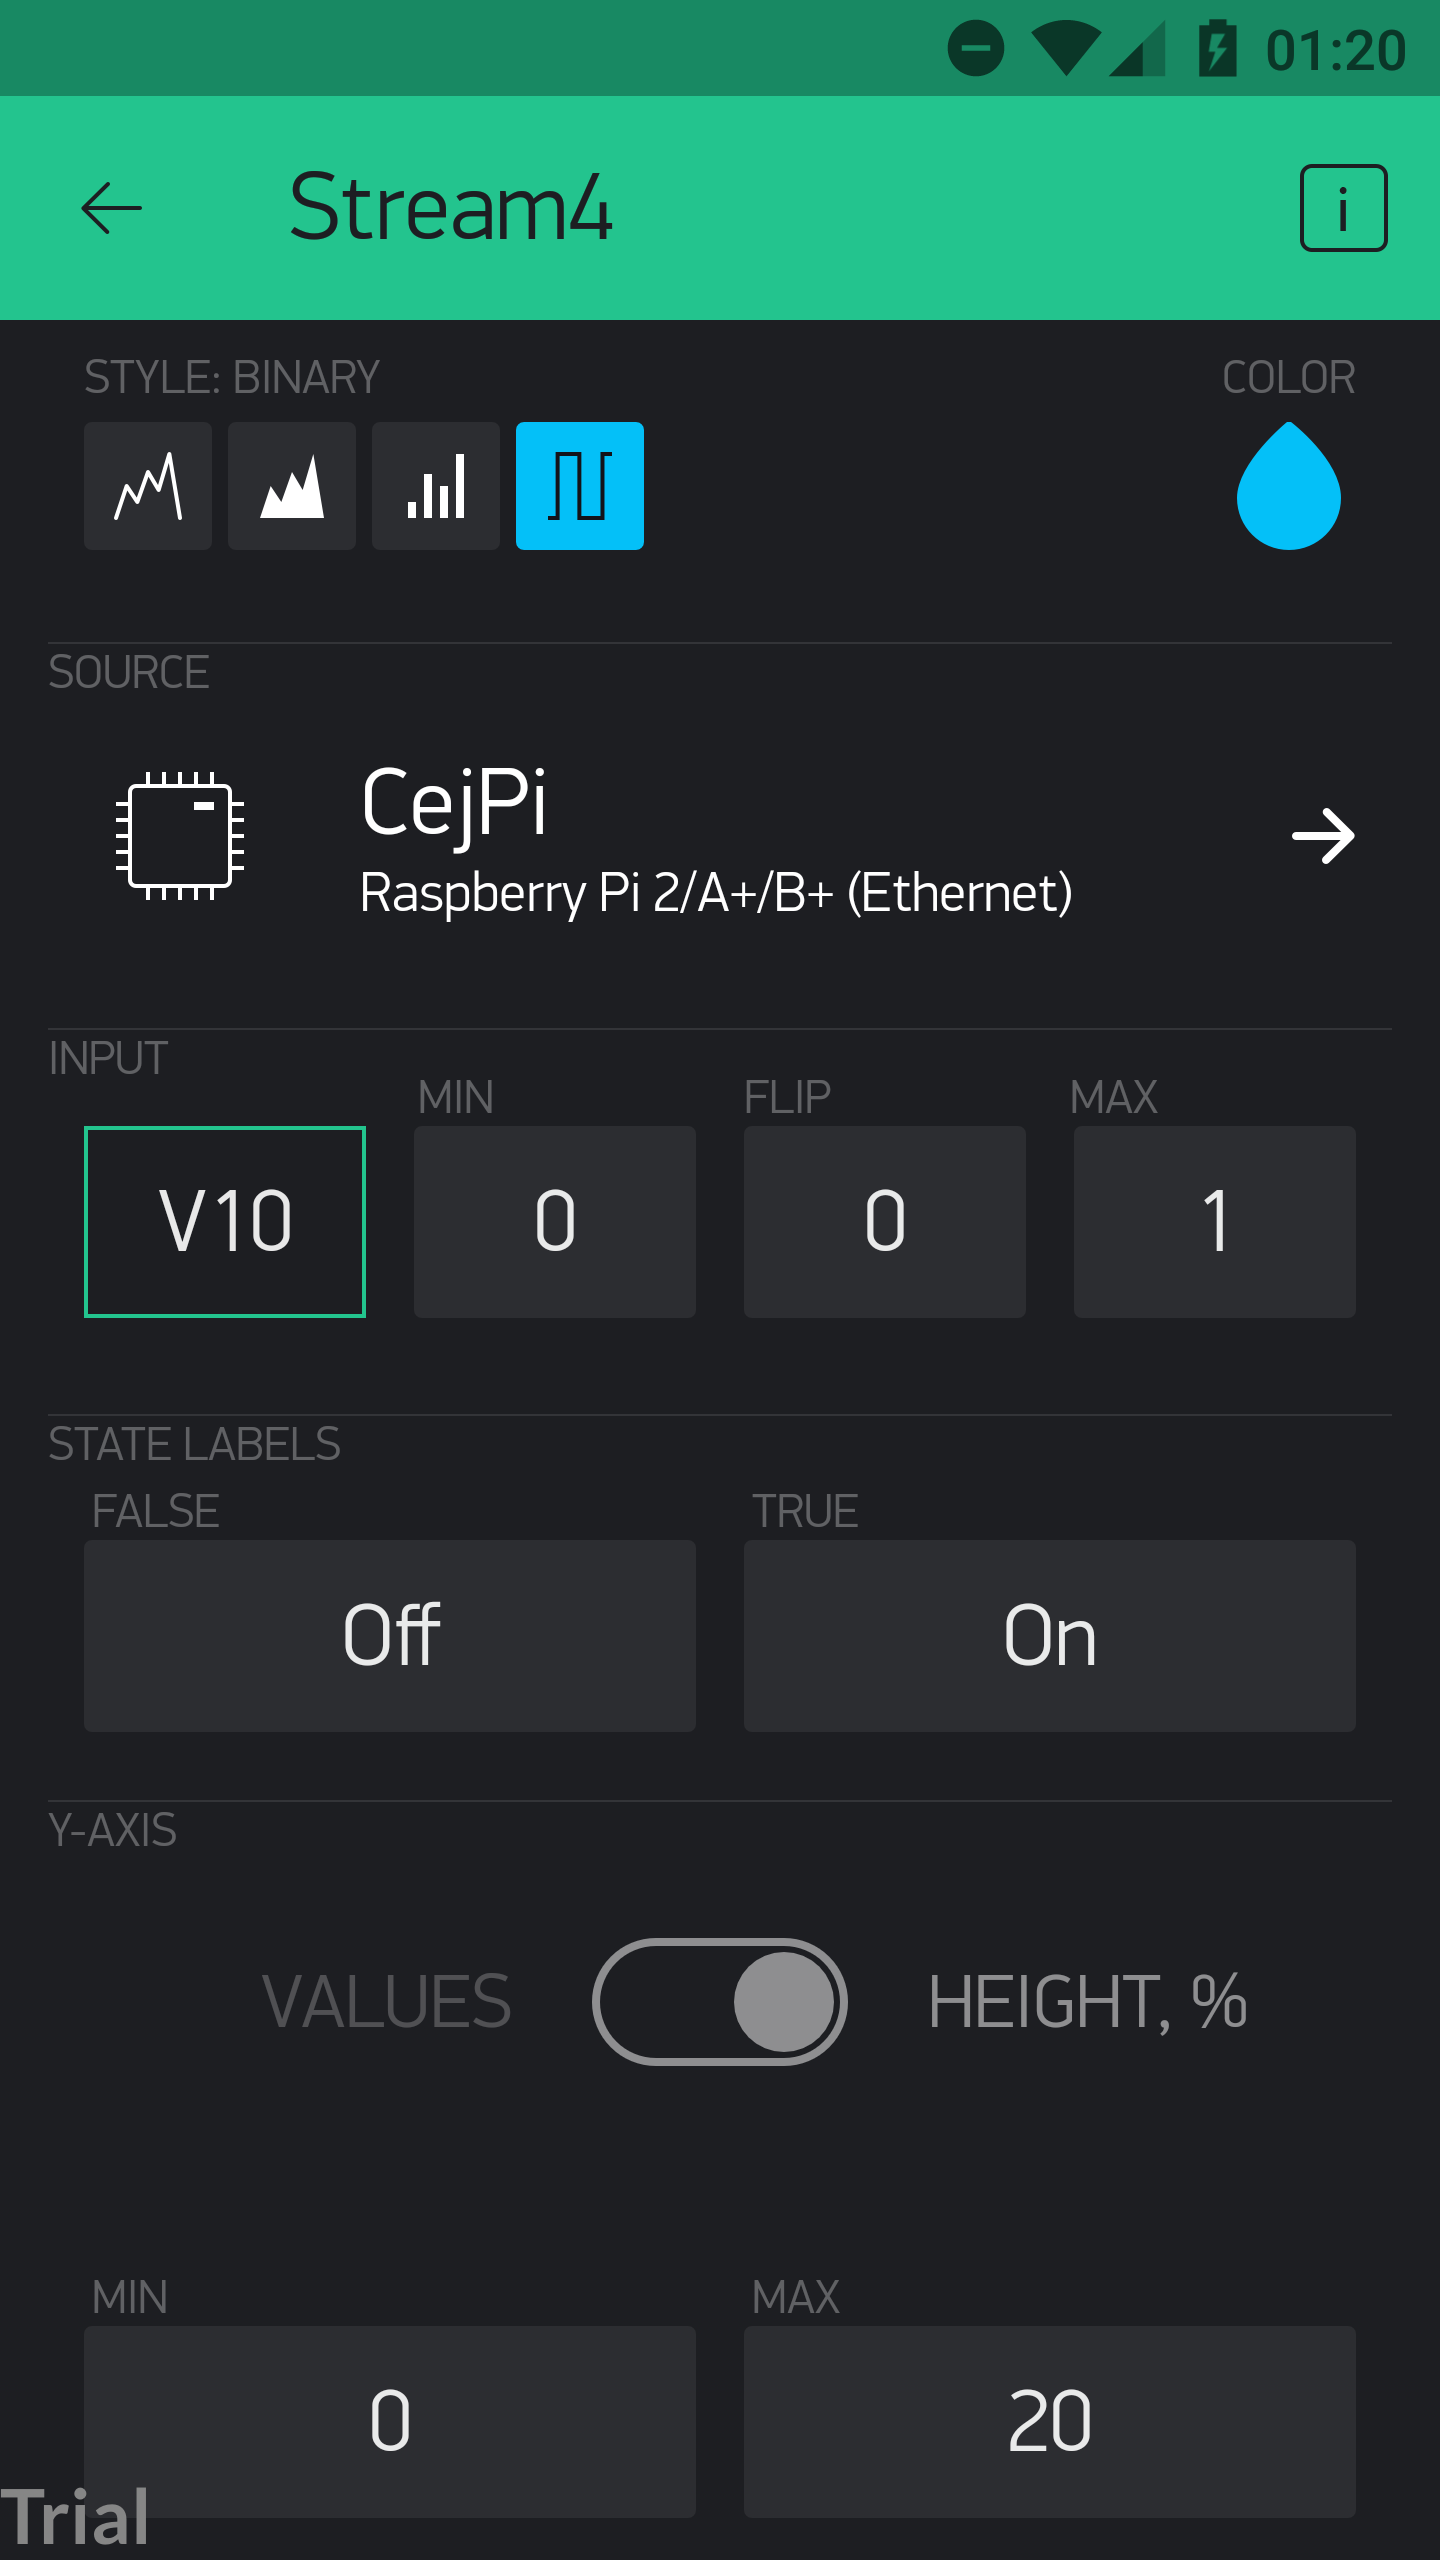
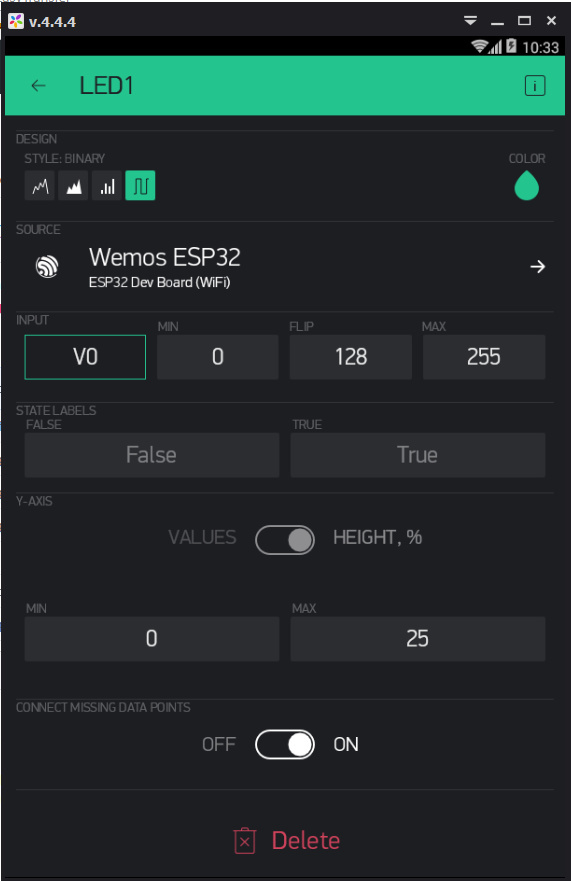
All 4 streams are binary so its per default that Y is in % (not changeable).
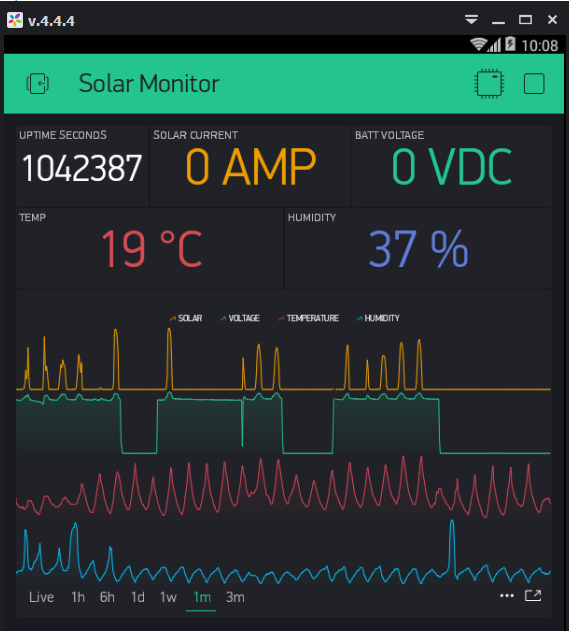
Shadow I call overlapping of the colors which are outside of the given MAX and MIN value. You see that the orange “shadow” gets to the Green 0 value. And the Green 0 value shadow goes low to Blue 0 value. This is not the case in the picture above from the documentation. In the picture from the documentation, all 4 streams have their own space of operation, without interfering with other streams.
Trust me it is not, I can not find my self around my own code…
And the reason I send 0 and 1 to a Button is to use a Button as an Led, so you kill 2 flies with one swat. The thing is, not just the user can press the button (trigger the event), the hardware can also, so the user hast to get the info when the hardware triggered the button.
Imagine a fan which is controlled by the temperature, the hardware can activate the fan according to the temperature, but the user can also activate the fan. They both use the button as an indicator if the fan is activated but the user also uses the button just as an button. And the reason I send the same state every 4 seconds is just for the graph to catch the lines.
Well, I haven’t played around with the Digital aspect of the SuperChart yet… but I get the correct looking layout with 4 data streams using the line charts… so I am wondering if there is something in your code that is contributing to how the data gets interpreted?
Yep, that’s what I said… wrong data set for simple binary chart anyhow. I was going to use your code to test with… becasue I am too lazy right now to write up my own To busy binge watching The Flash episodes
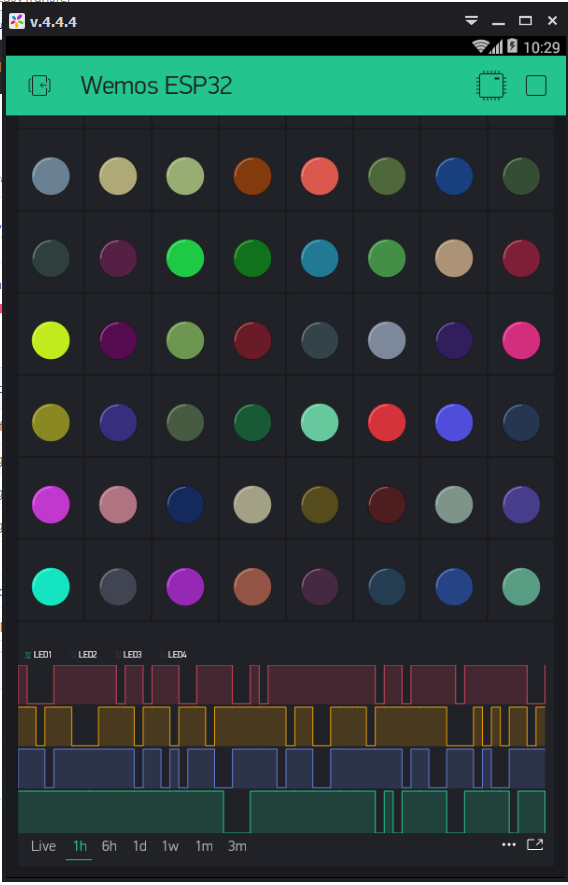
OK, I realized I already have a running datastream I could tap off of… 72 of them in fact (@Lichtsignaal ha… found a useful(ish) aplication for this program after all ;))
So I grabbed the intensity data from the first four LED’s and SuperCharted them just fine…
I think you have either some quirky data streams or something else is strangely set up.
Nice looking Chart @Gunner but I think it’s specifically with 0 and 1 states that might be the issue.
The Chart shown in the docs is similar to yours though in that most of the datastreams are for humidity where the values are 0 and 1.
Yesterday I knocked up a binary chart with 1 data stream and it was fine apart from the averaging because the vurtualWrite() was at 2 to 4 second intervals. Later I will try with the minimum 1 minute intervals and 4 datastreams.
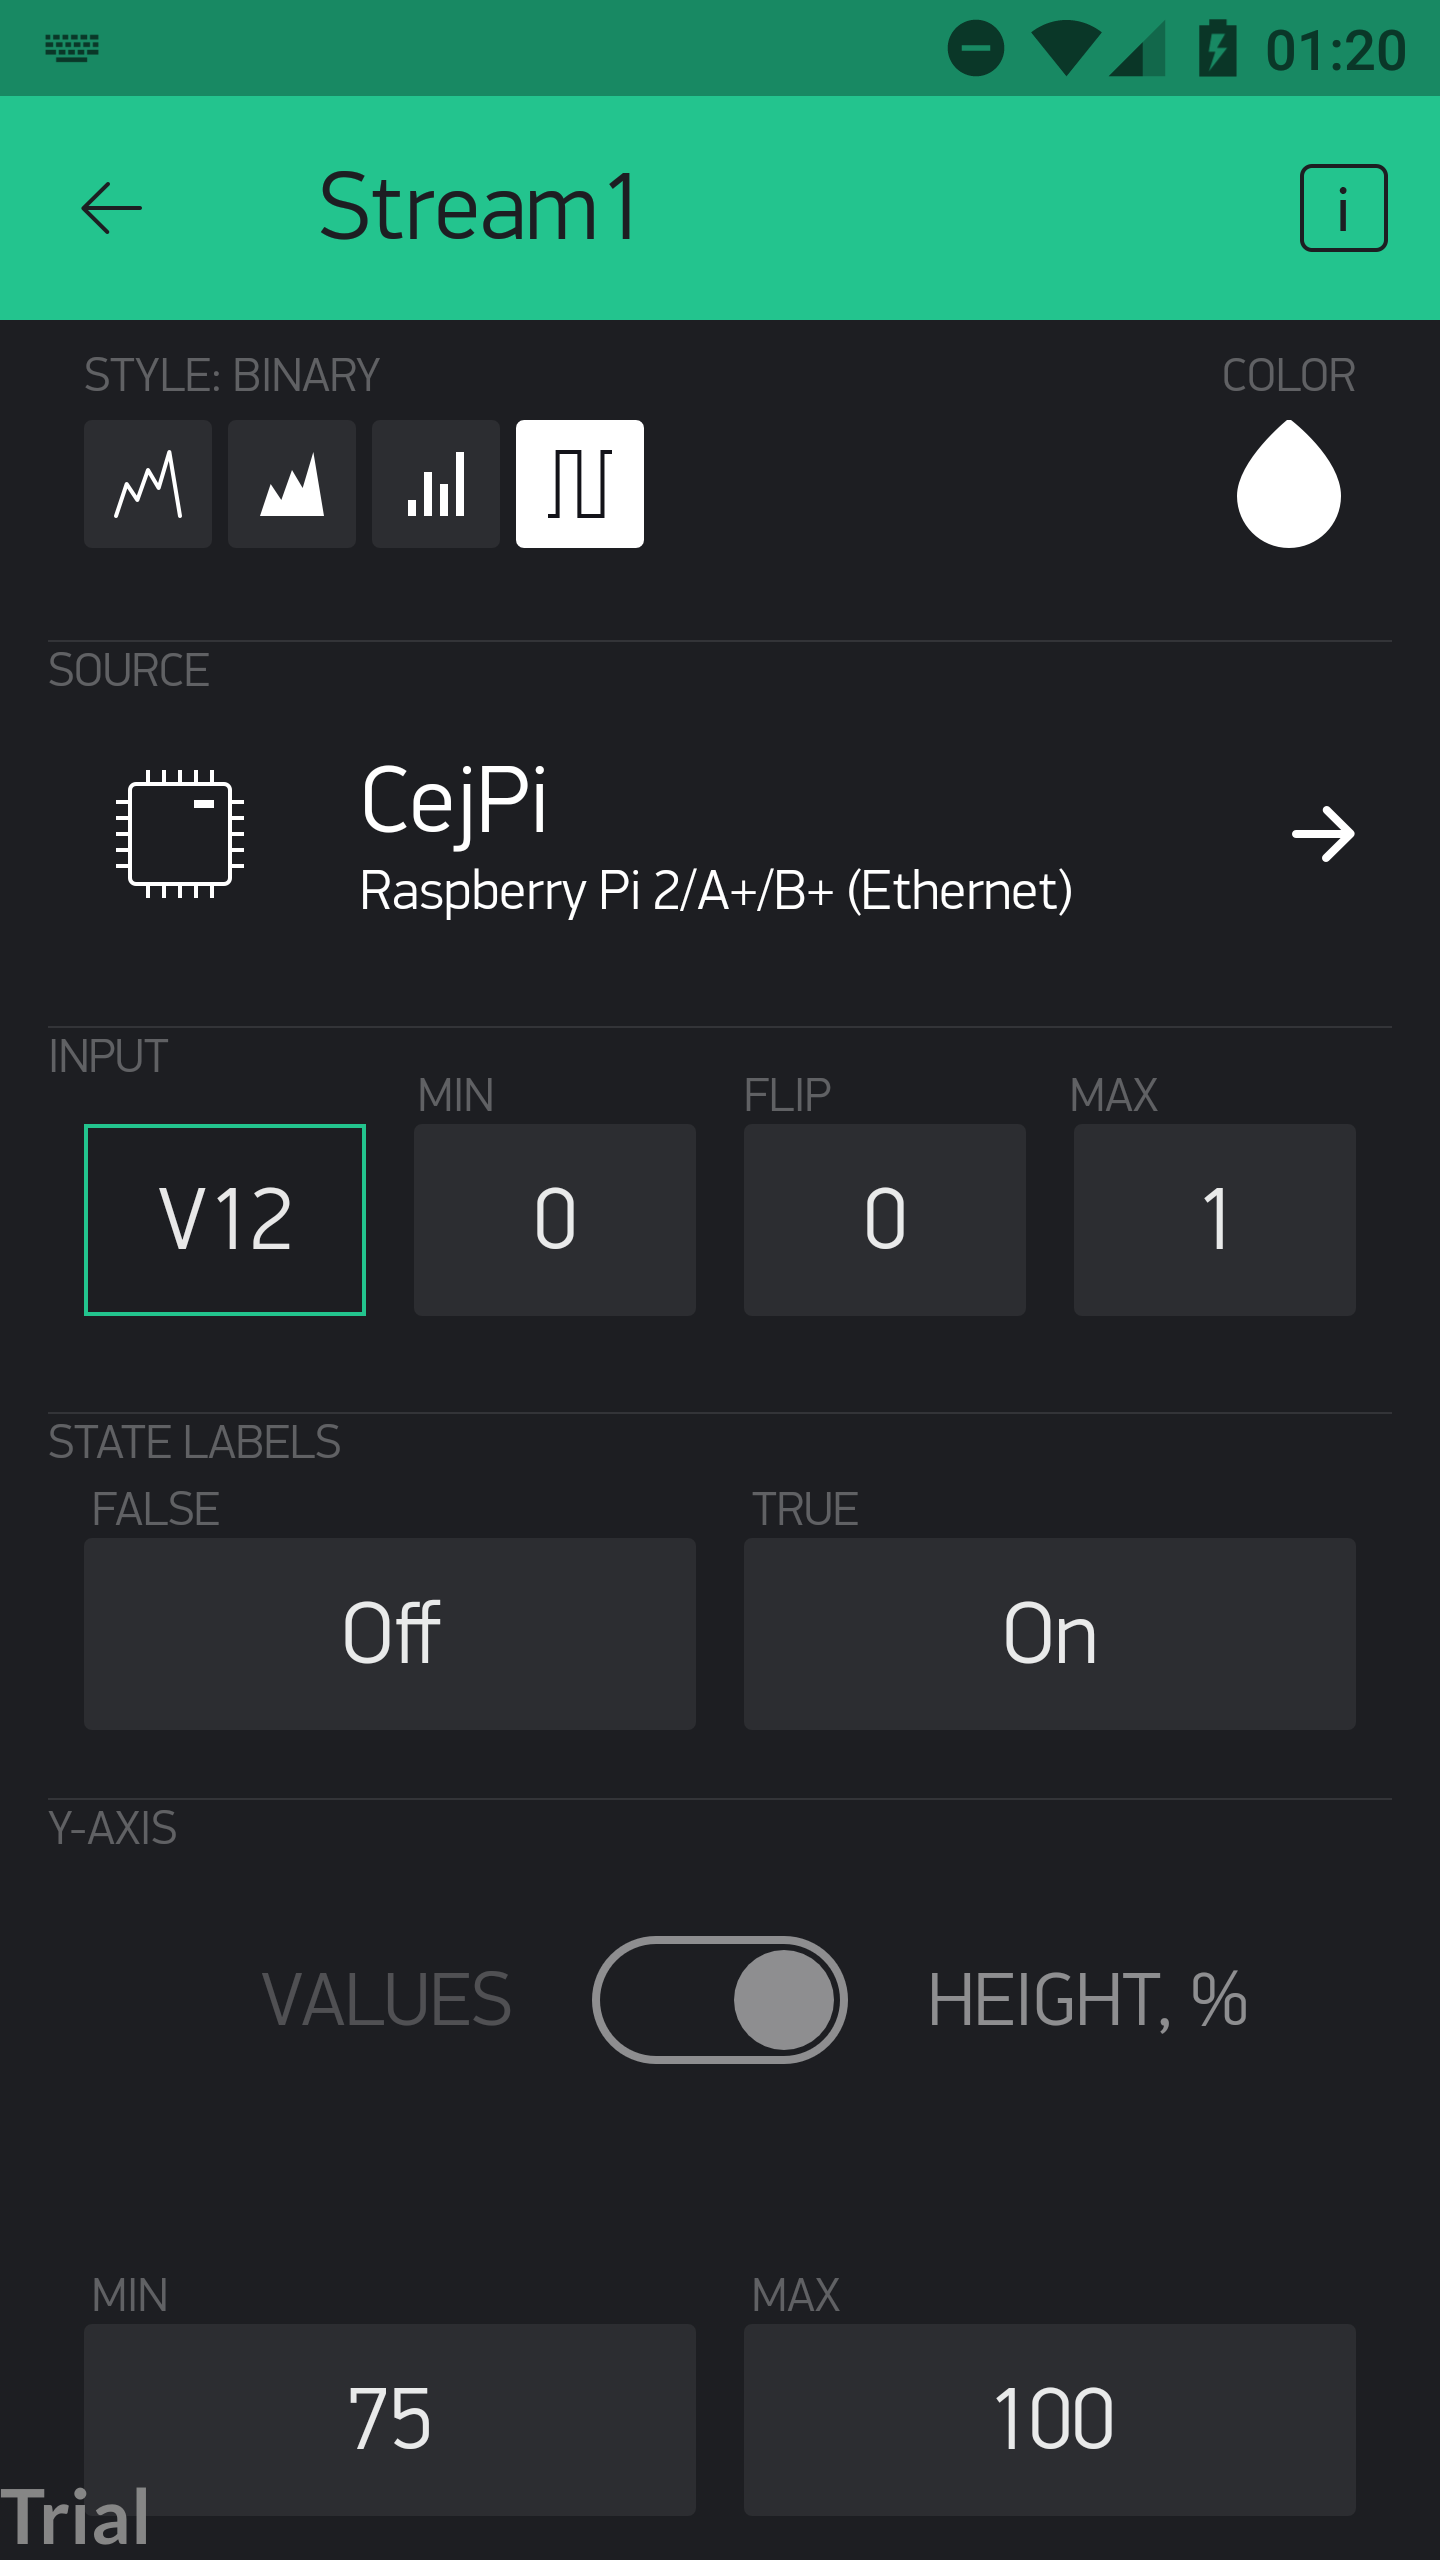
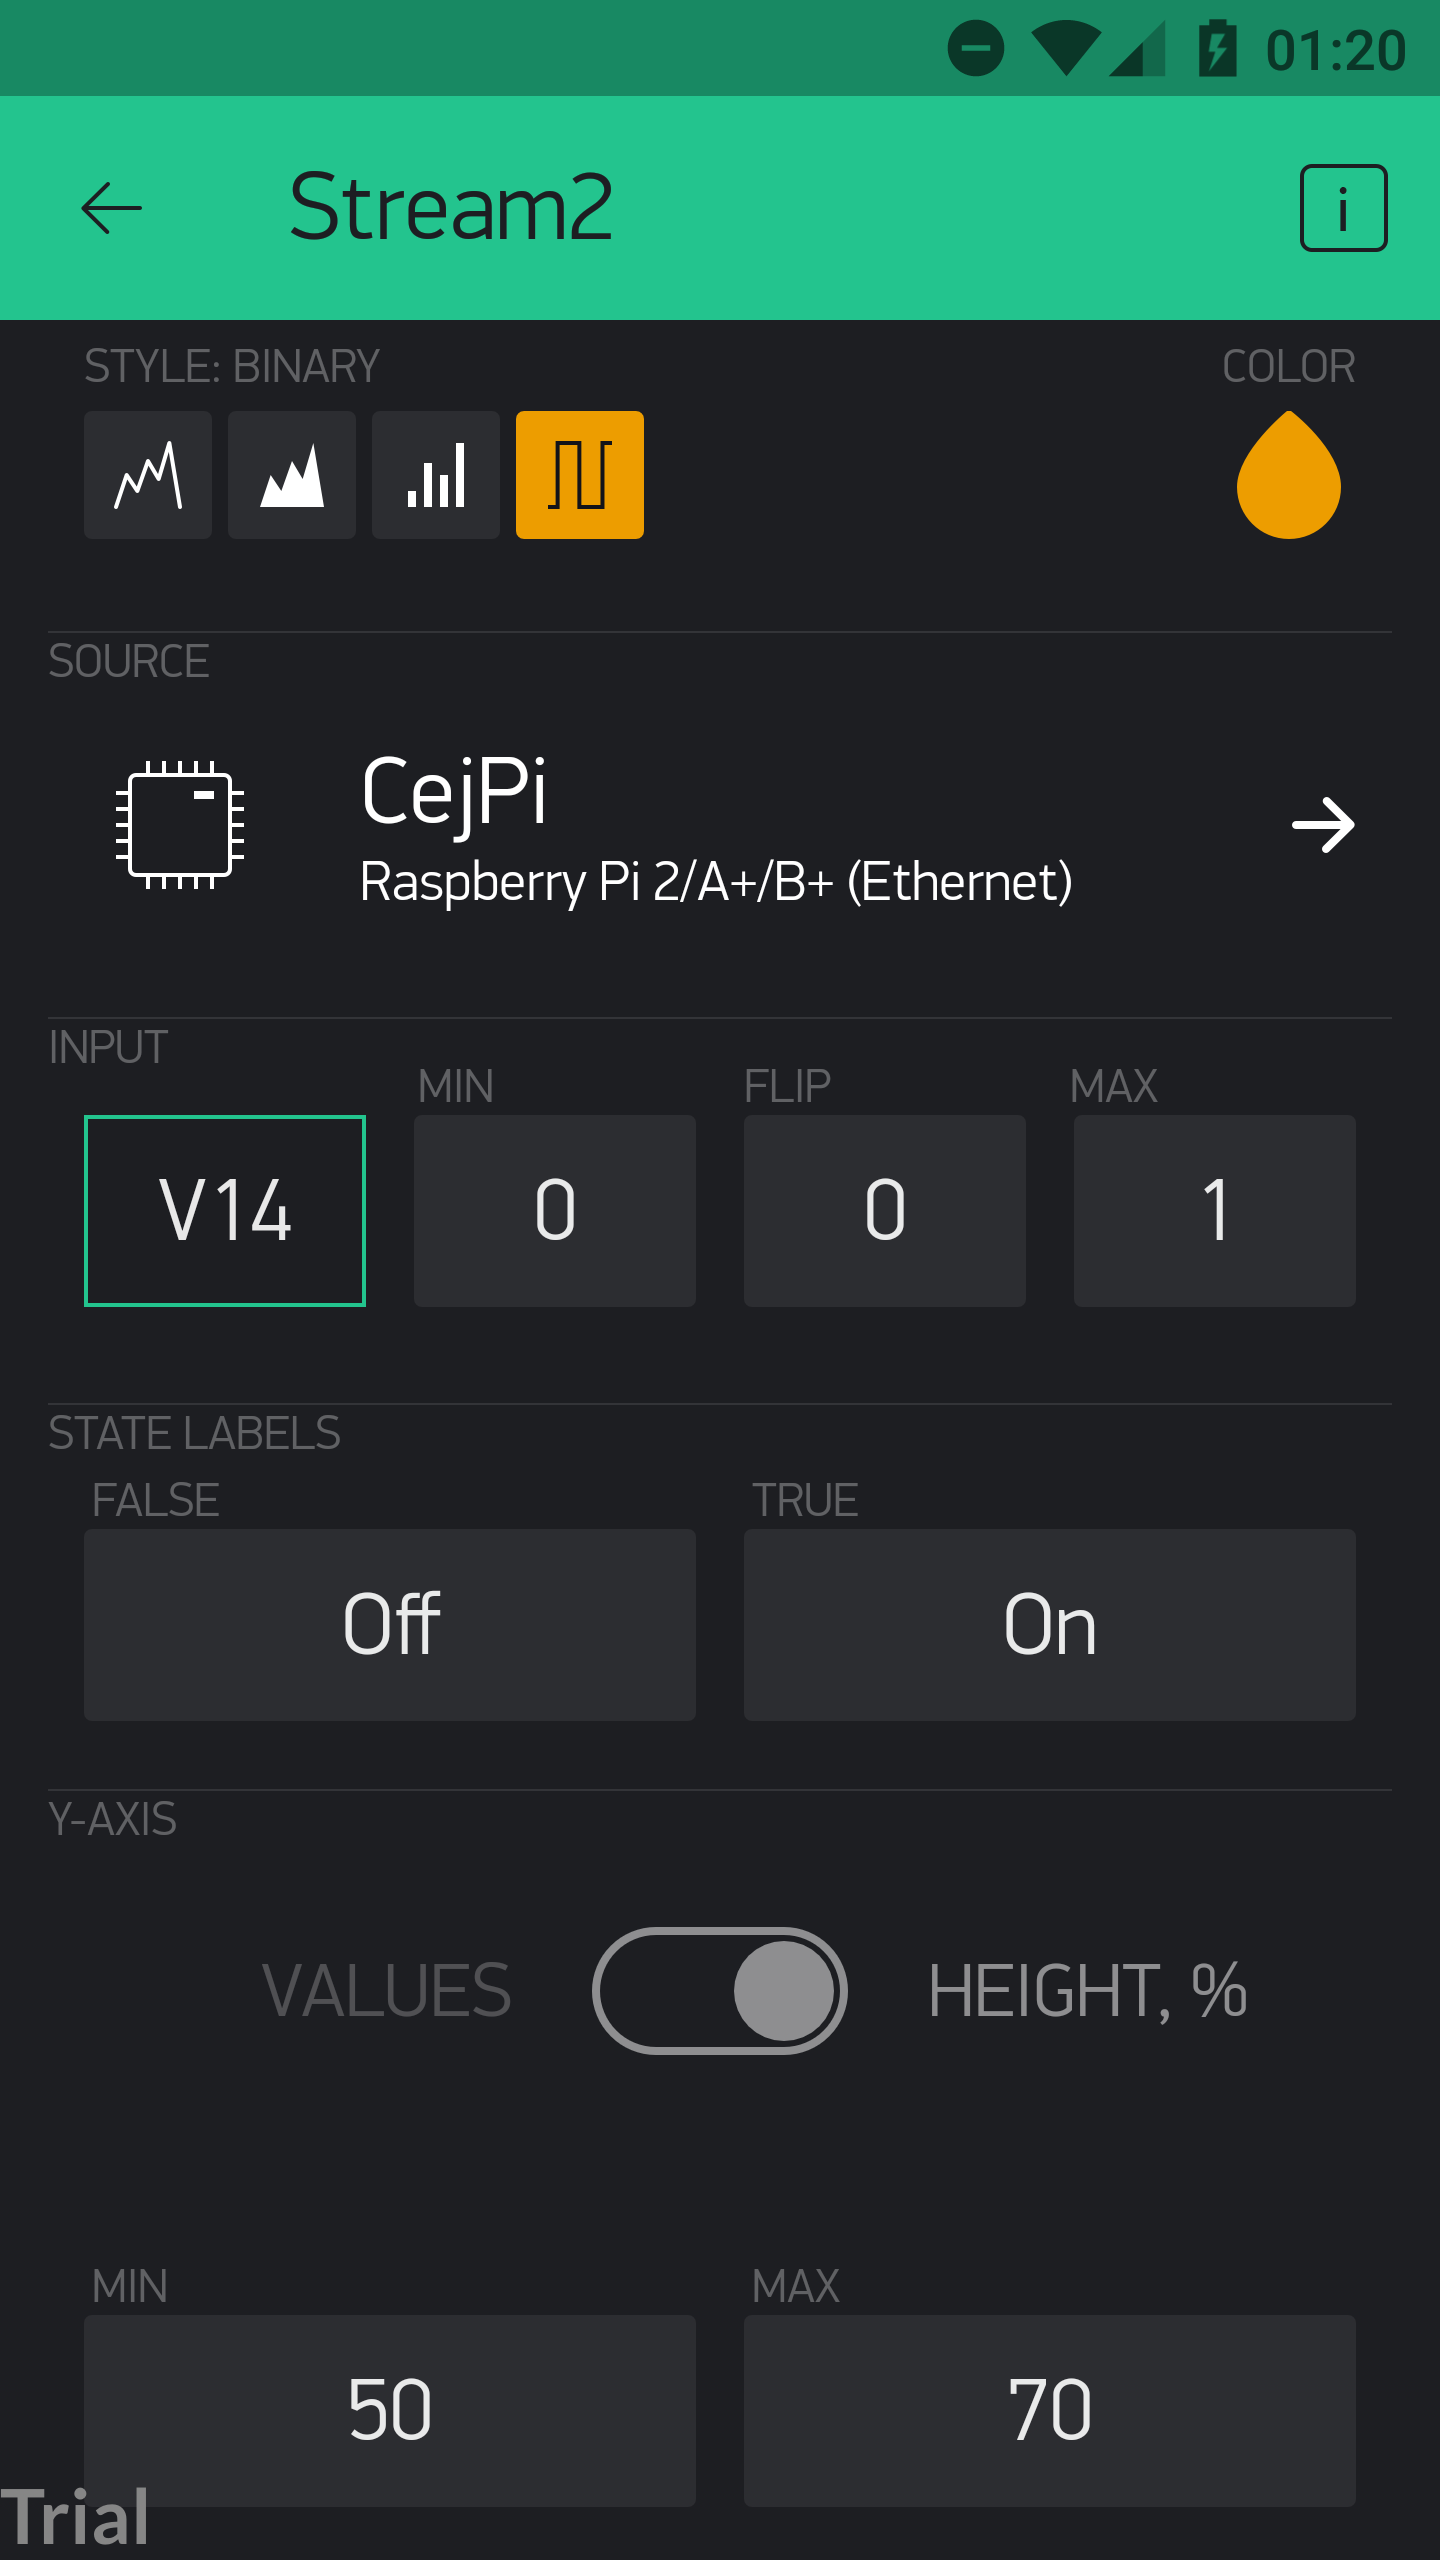
I can get that but I can not move it up, which the MIN and MAX setting should do. Try to set MIN at 50 and MAX at 100 that way you would move the signal to the upper part of the chart…that doesn’t work. You can find the MIN and MAX settings in the stream settings, same place where you select the virtual pin for the stream.

