• Hardware model : espurna on ESP8266
• Smartphone OS (iOS or Android) + version : Google Pixel3 XL (Android9)
• Blynk server or local server : Blynk server
Hi there
The same Vitrual pin (V3) is used to display values in Labeled Value and SuperChart.
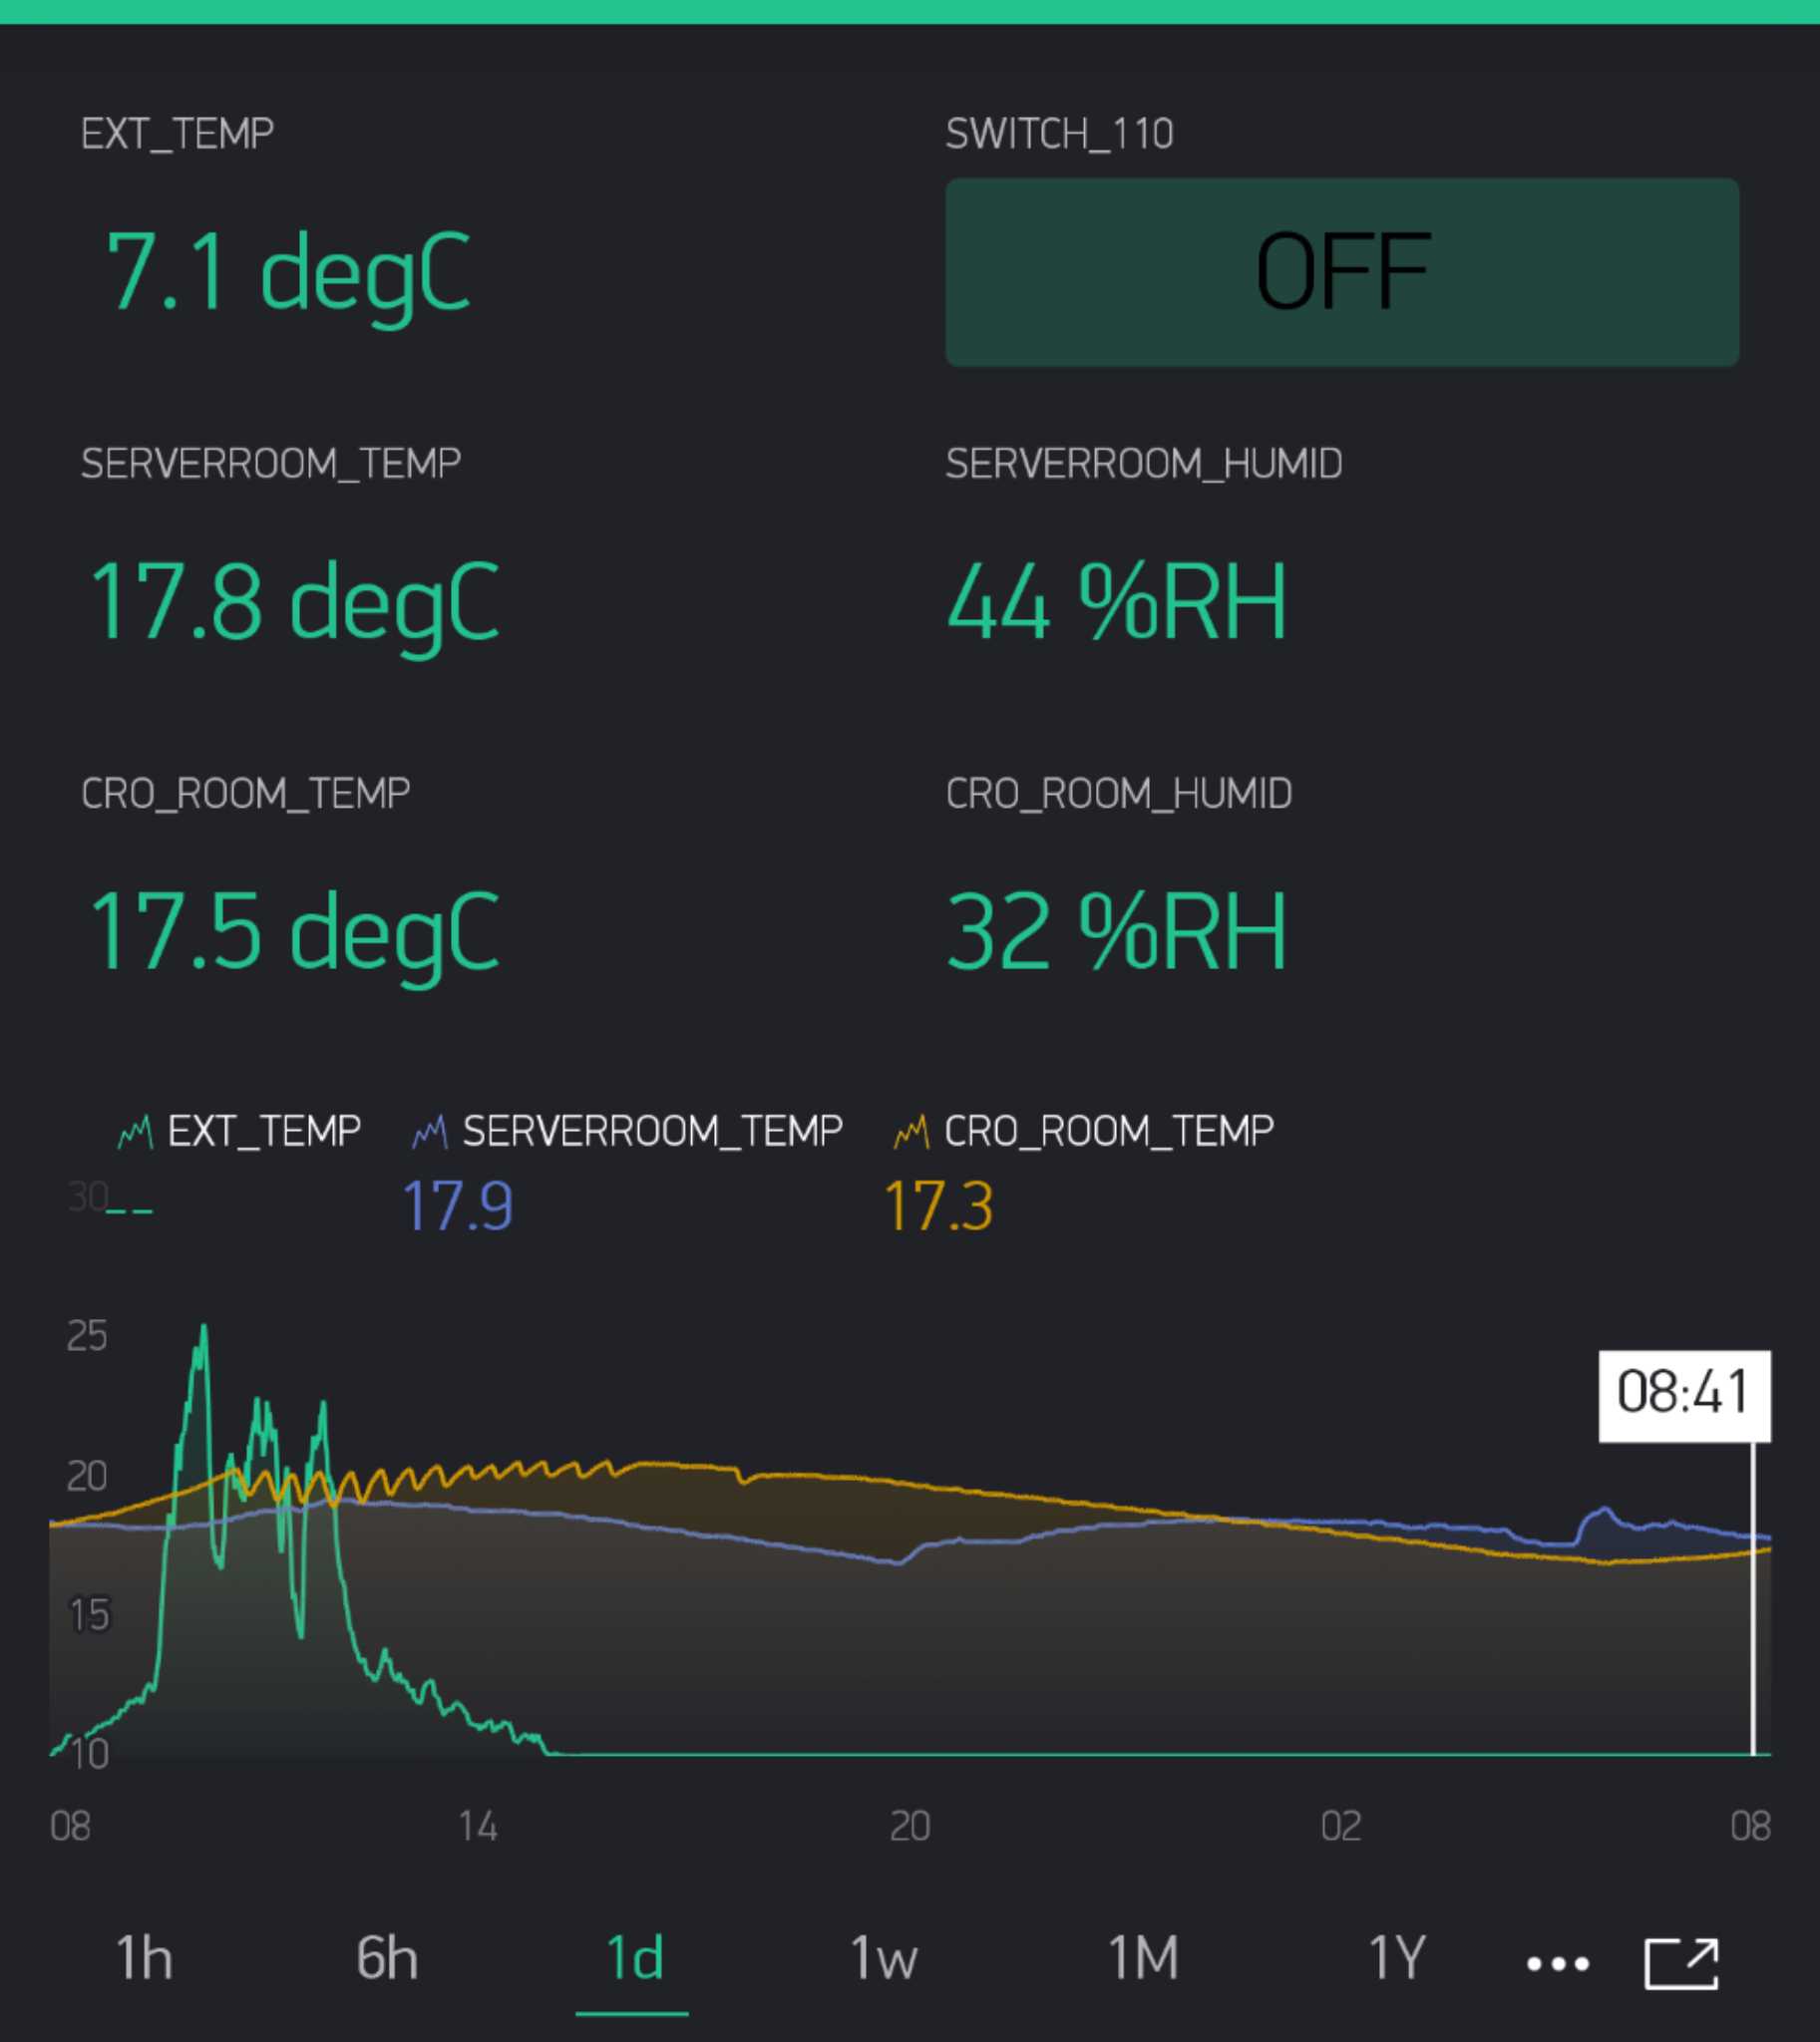
What I regard as a problem is the attached photo “EXT_TEMP”.
You can see that the Labeled Value text shows about 7degreeC below 10degC.
However, SuperChart displays “-” indicating invalid data although it should refer to the same Virtual Pin, and the graph line is stable at 10degC.
I was unable to find a feature in SuperChart that limits the upper and lower limits of the value. What causes this phenomenon?
It’s covered in the “Y-Axis Settings” part of the SuperChart documentation:
https://docs.blynk.cc/#widgets-displays-superchart
I wouldn’t necessarily have expected it to produce the result you’re seeing, but maybe that’s how it’s designed to work to avoid confusion.
Pete.
Hi pete Thank you for your comment.
After the first post, I waited until I could reply.
Yes, I have already read the document you indicated.
After my first post, I experienced a very cold time and realized that this wasn’t a Y-scale issue.
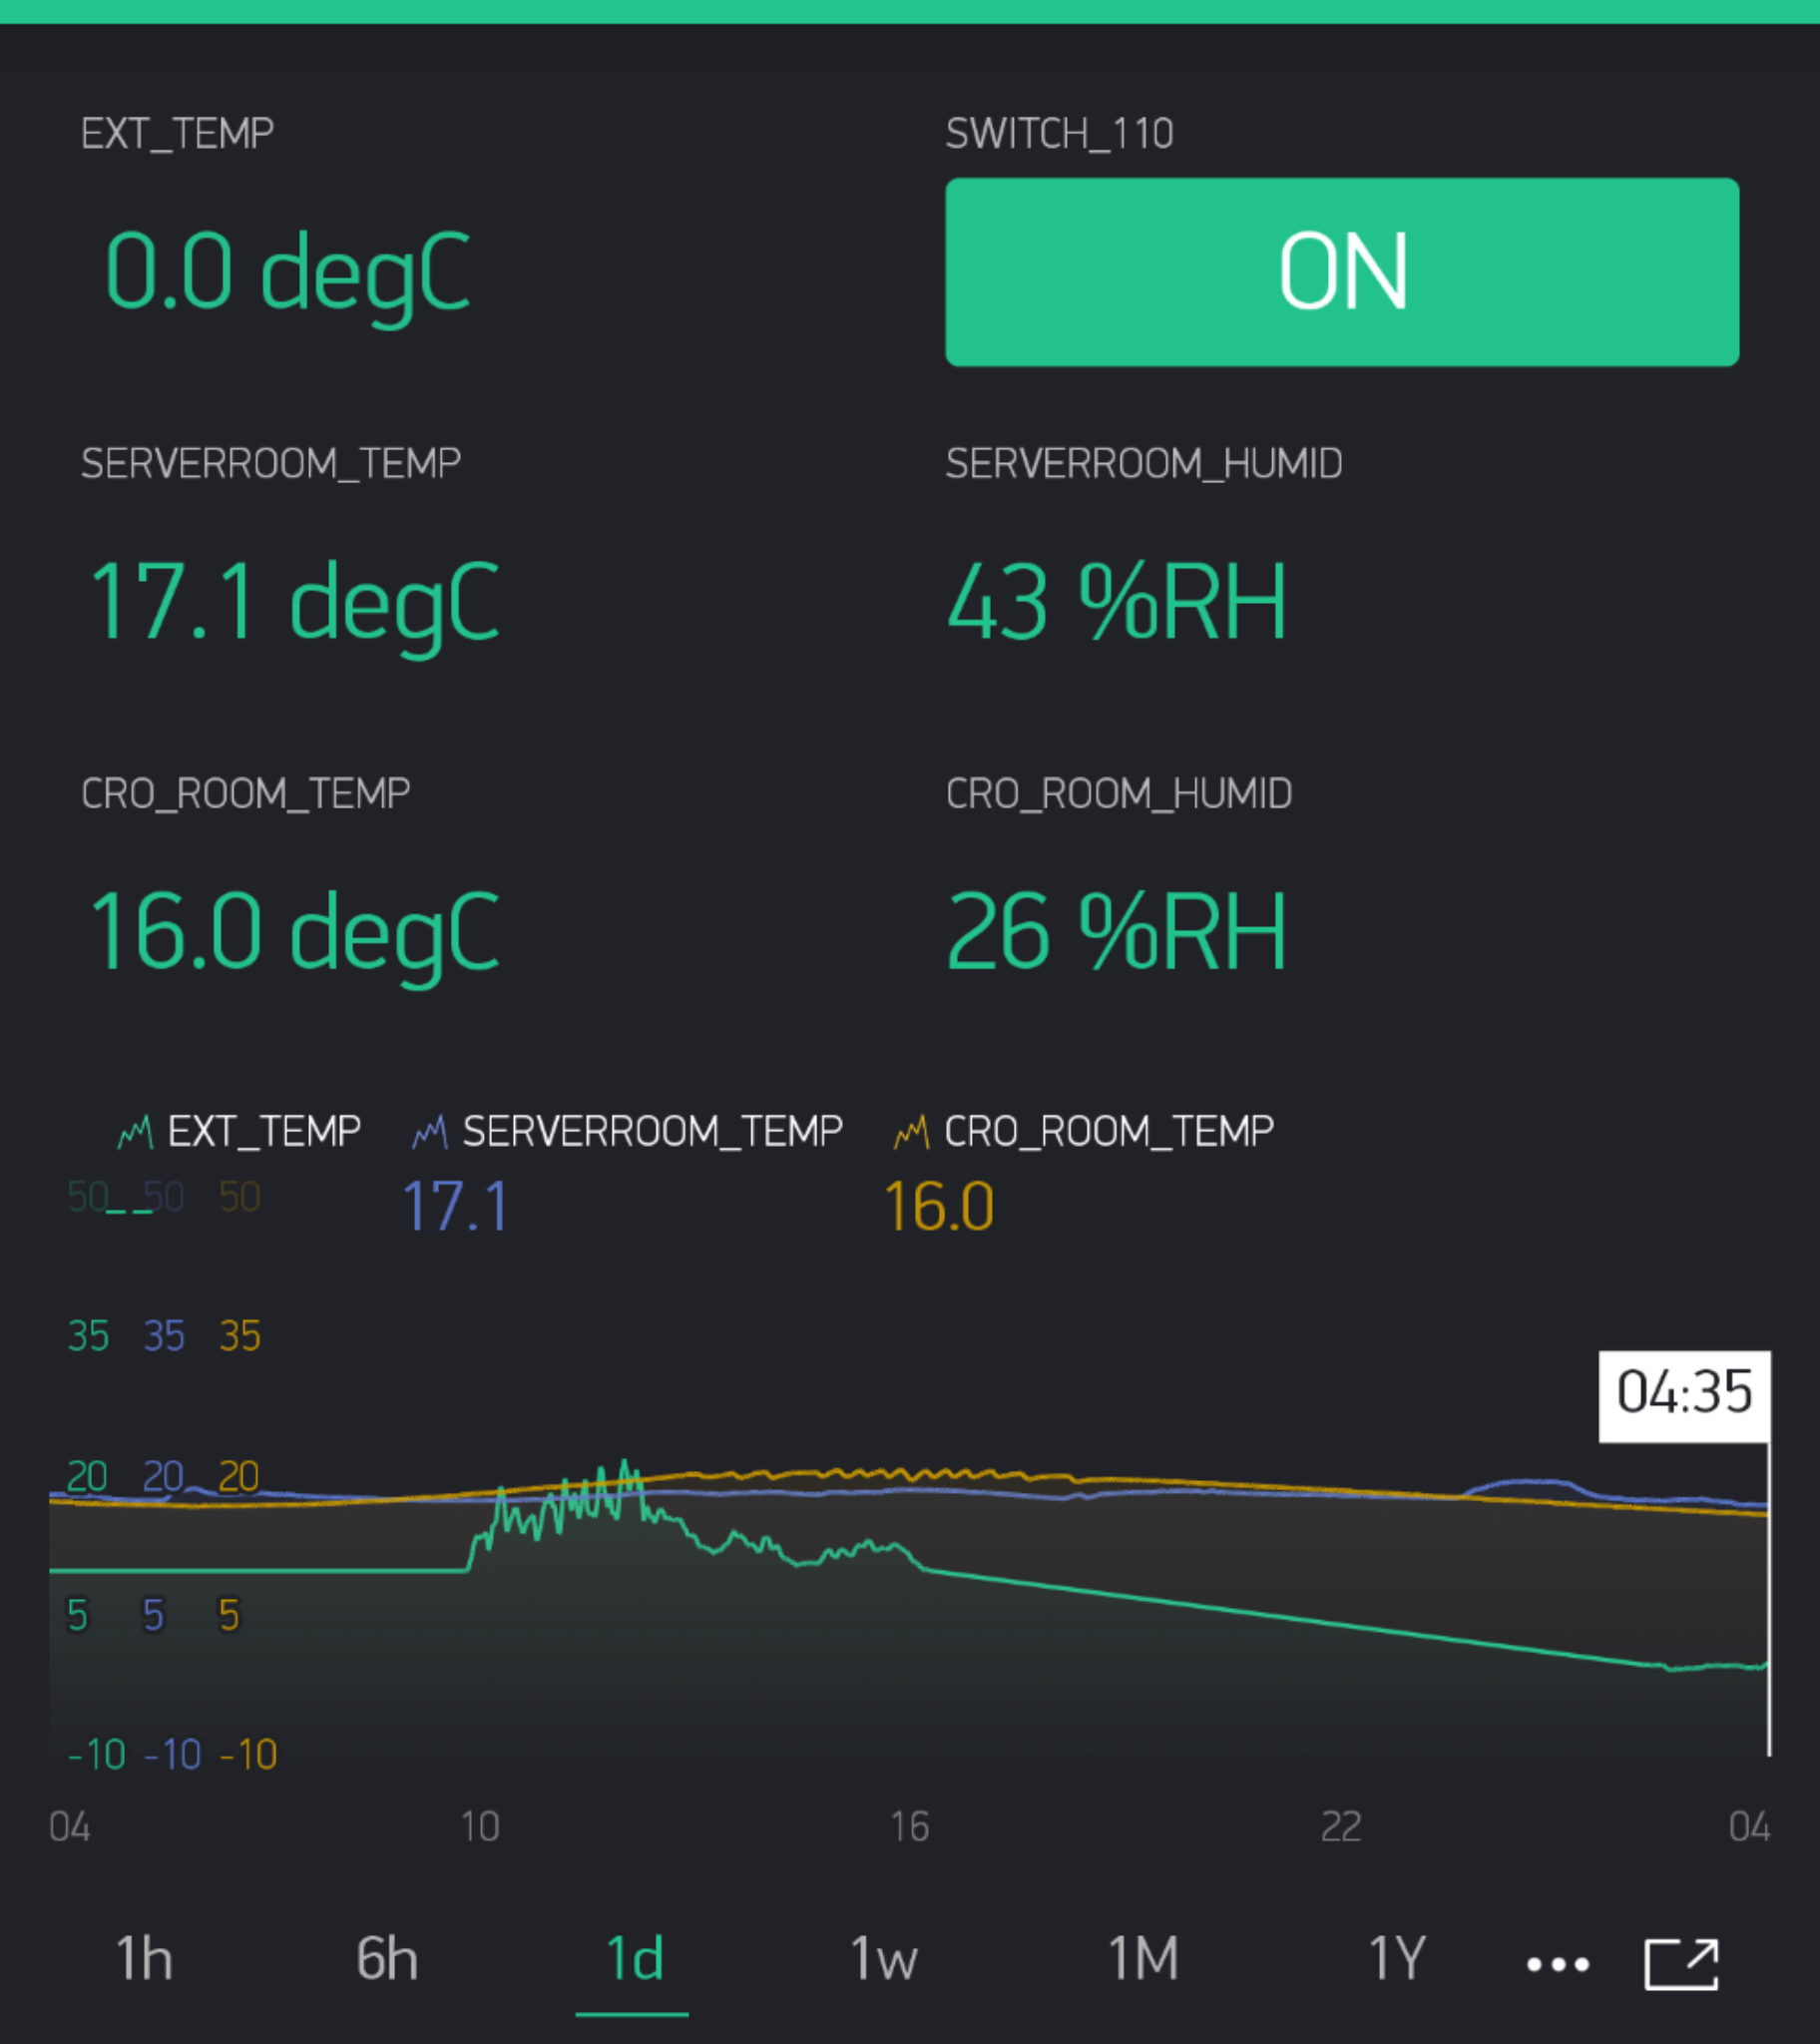
In my Android environment, in the range of 9.9degC to 0.0degC, SuperChart shows that it is not valid data as “–”.
0.0degC is not valid. (Look at the numbers shown in SuperChart’s “EXT_TEMP”.)
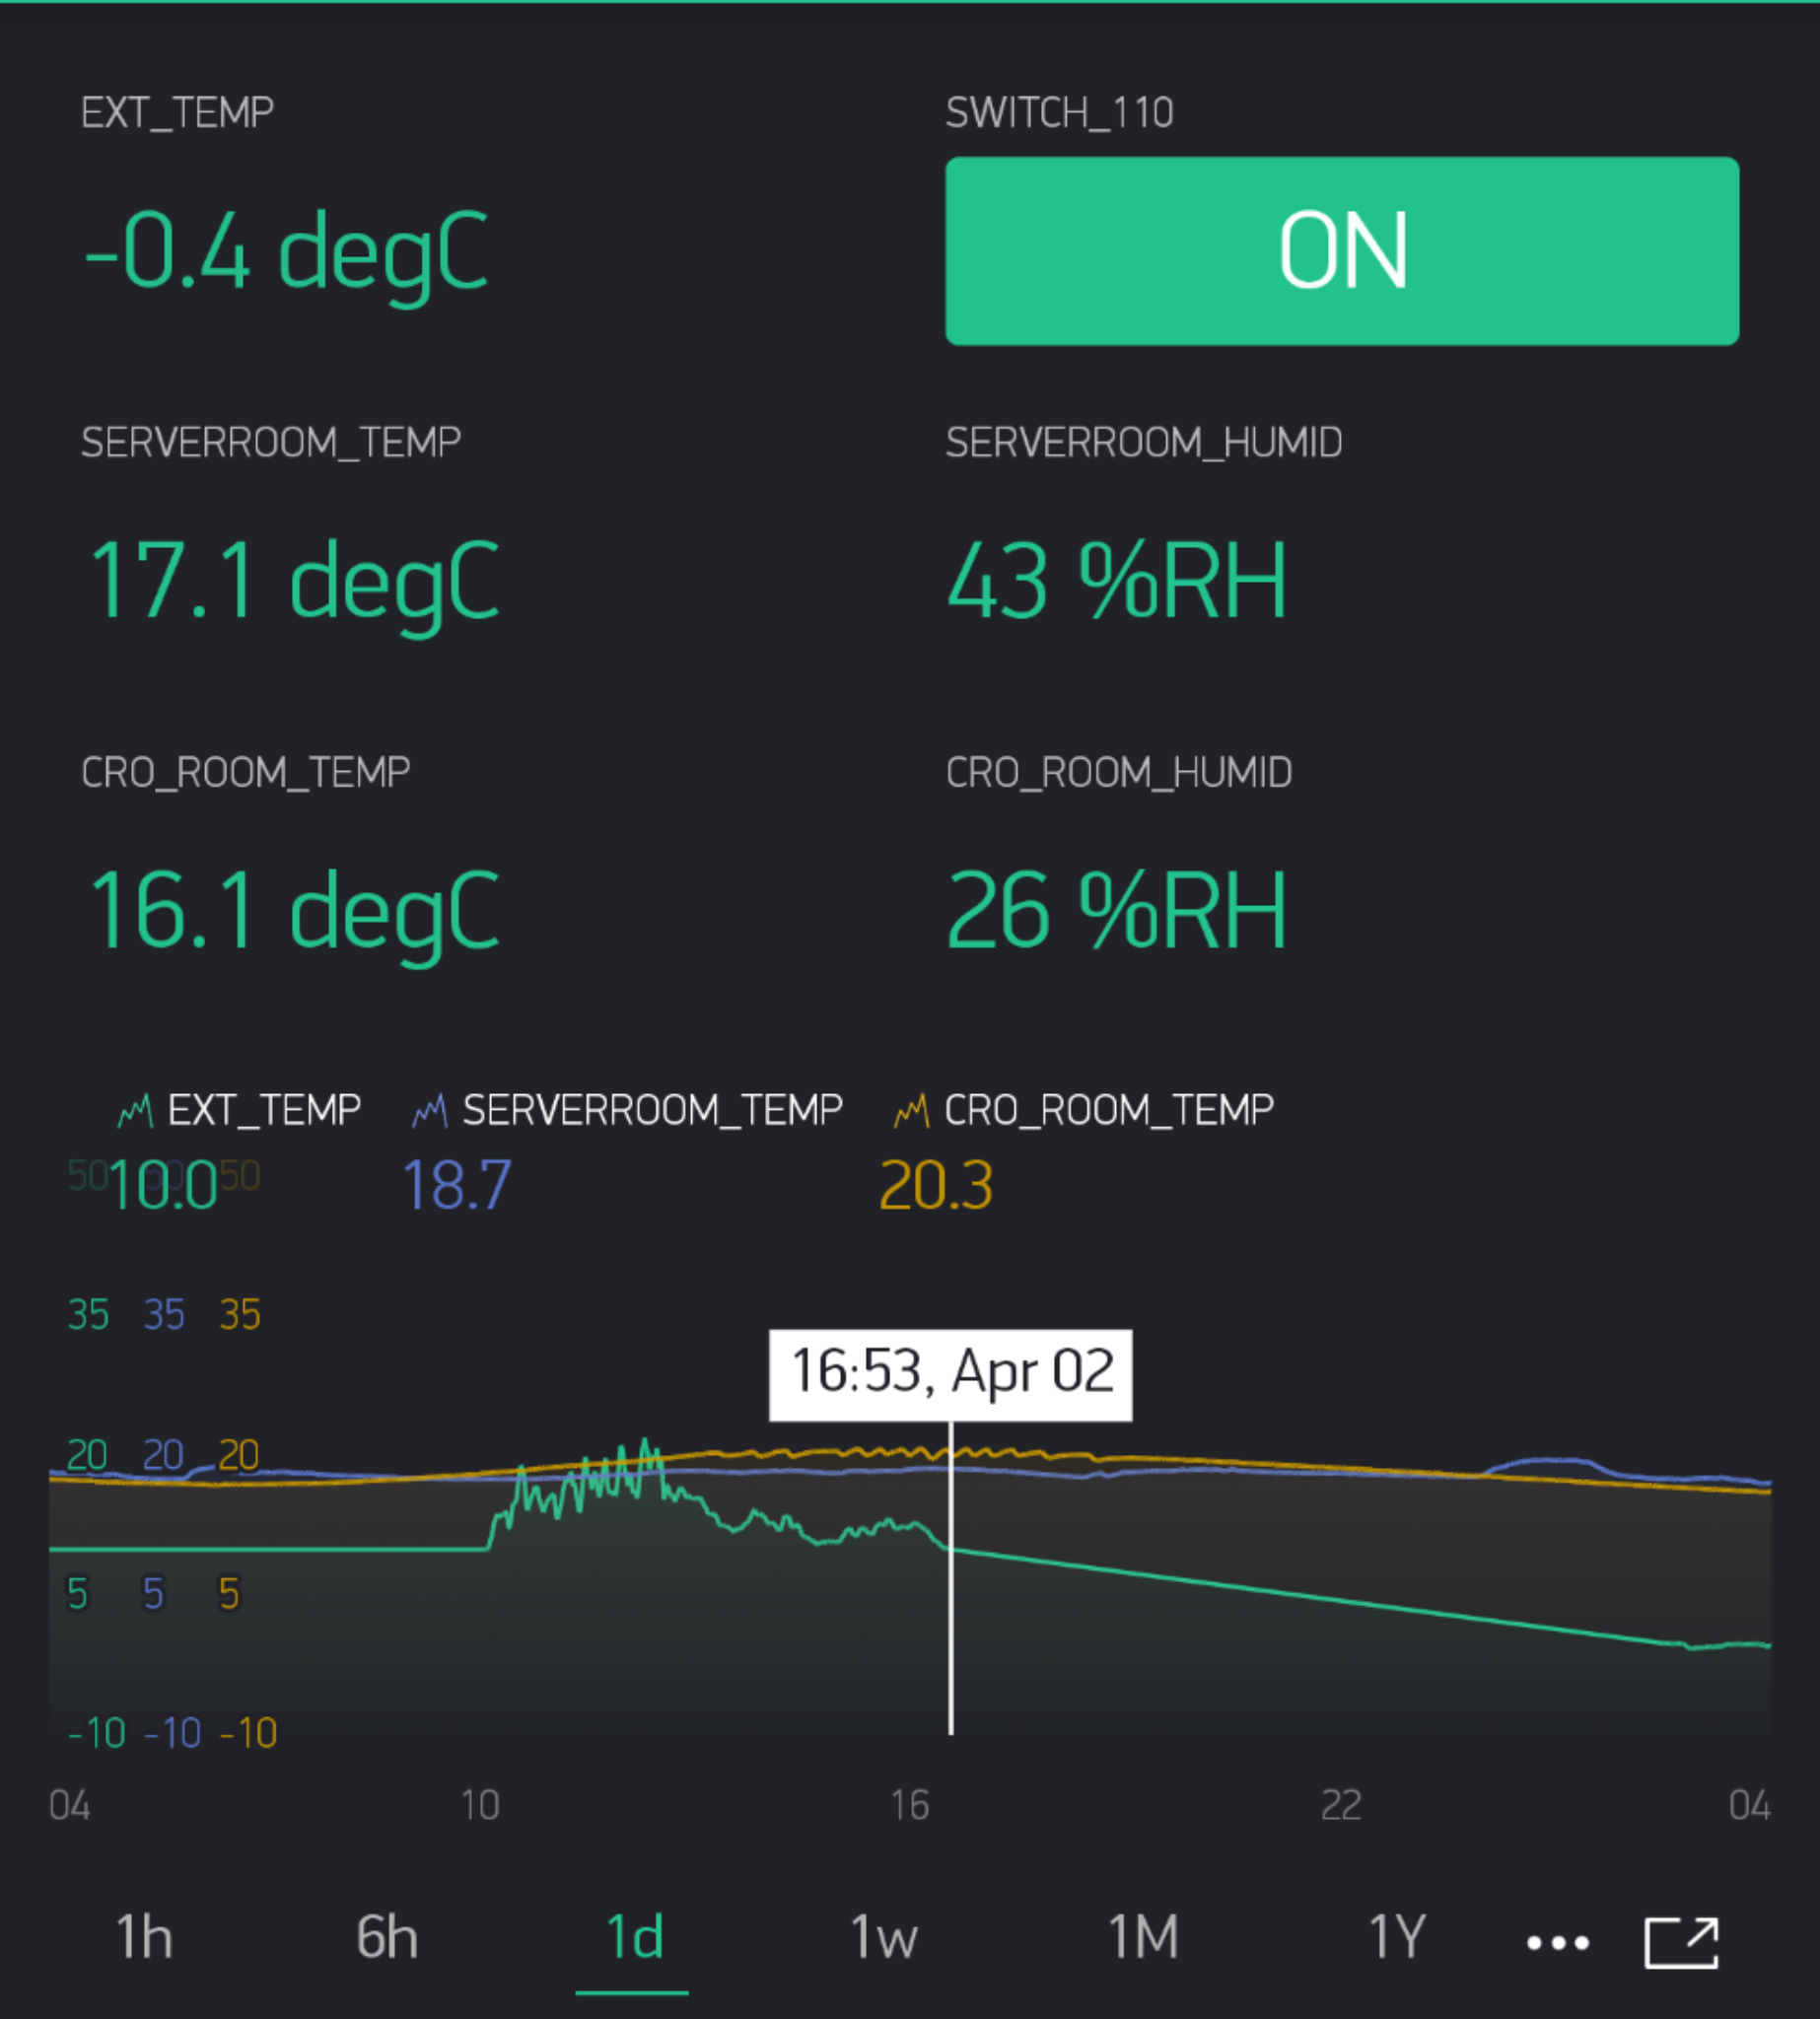
-0.1 degC seems to be received as valid data as well.
At 10.0 degC, it is received as valid data.
Thanks
cronos_sv
This issue could be solved using beta version 2.27.6.