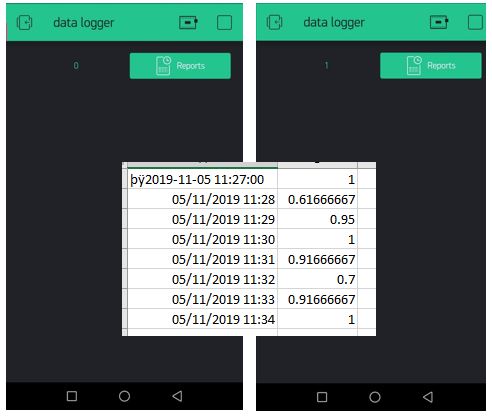
I am using Nodemcu board for monitoring a digital input. All I want to report is the state of the input (HIGH or LOW represented by 1 and 0). The problem is that the report shows data with decimal point between 0 and 1, such as 0.95 or 0.7. The data is written from the board using virtual pin V0.
I have the Blynk app on an Android cellphone. In the app side, I have a display that shows the correct value (0 or 1) provenient from virtual pin V0, so I think that the problem is with the Report Widget.
Here is the code:
BlynkTimer timer; // Announcing the timer

void setup()
{
  Serial.begin(9600);
  Blynk.begin(auth, ssid, pass);
  timer.setInterval(1000L, sensorDataSend); //timer will run every  sec
  pinMode(D5,INPUT_PULLUP); // The input pin to be monitored
}

void loop()
{
  Blynk.run();
  timer.run();        // run timer every second
}

void sensorDataSend()
{
  if(digitalRead(D5)==HIGH){
    Blynk.virtualWrite(V0,1);
  }
  else{
    Blynk.virtualWrite(V0,0);
  }
}
Here is screenshot of the app and the collected data:
Superchart supports currently 2 types of granularity:
Minute granularity - 1h , 6h , 1d ;
Hour granularity - 1w , 1m , 3m ;
This means that minimum chart update interval is 1 minute for 1h , 6h , 1d periods. 1 hour for 1w , 1m and 3m periods. As Blynk Cloud is free to use we have a limit on how many data you can store. At the moment Blynk Cloud accepts 1 message per minute per pin. In case you send your data more frequently your values will be averaged. For example, in case you send value 10 at 12:12:05 and than again 12 at 12:12:45 as result in chart you’ll see value 11 for 12:12.
In order to see data in chart you need to use either widgets with “Frequency reading” interval (in that case your app should be open and running) or you can use Blynk.virtualWrite on hardware side. Every Blynk.virtualWrite command is stored on server automatically. In that case you don’t need application to be up and running.
It looks like that is the reason, because when I keep the input high or low during the whole sampling time, the reports shows only 1’s or 0’s. I will modify the code so that it writes virtual pin V0 with less frequency. Thank you for the reply.
Well, I’m not using Superchart but I guess the same applies for Report Widget. Thank you for your reply and for the given information, now I’m able to rewrite my code in order to have the desired output.