Hi to everyone,
I’m developping a project with the energy meter PZEM004 for monitoring the energy produced by my photovoltaic system.
I’m using SUPERCHART widget to plot the real time energy produced and no problem with this feature.
I’d like to create another chart with the total daily production, the idea is to plot at each day the value of the energy produced. So in one month I can se the total energy produced day by day. See below what I mean (this is the graph showed by the web page of the inverter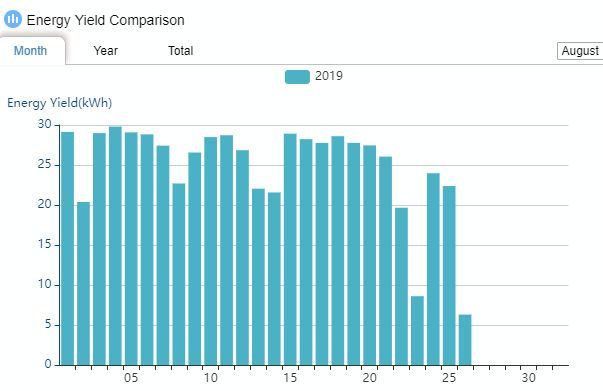 )
)
I tried to plot the value once a day at 00.00. But I see a graph with only one value each 24h. Between each daily transmission i see only 0 values.
One solution could be to plot at each hour the daily energy produced the day before (always the same value, 24 transmissions of the same value per day). In this way when I set in the X axis “1 month” I will see only one value per day (but, for example, the value of the day 10, the value is really of the day before)…
Any suggestions?