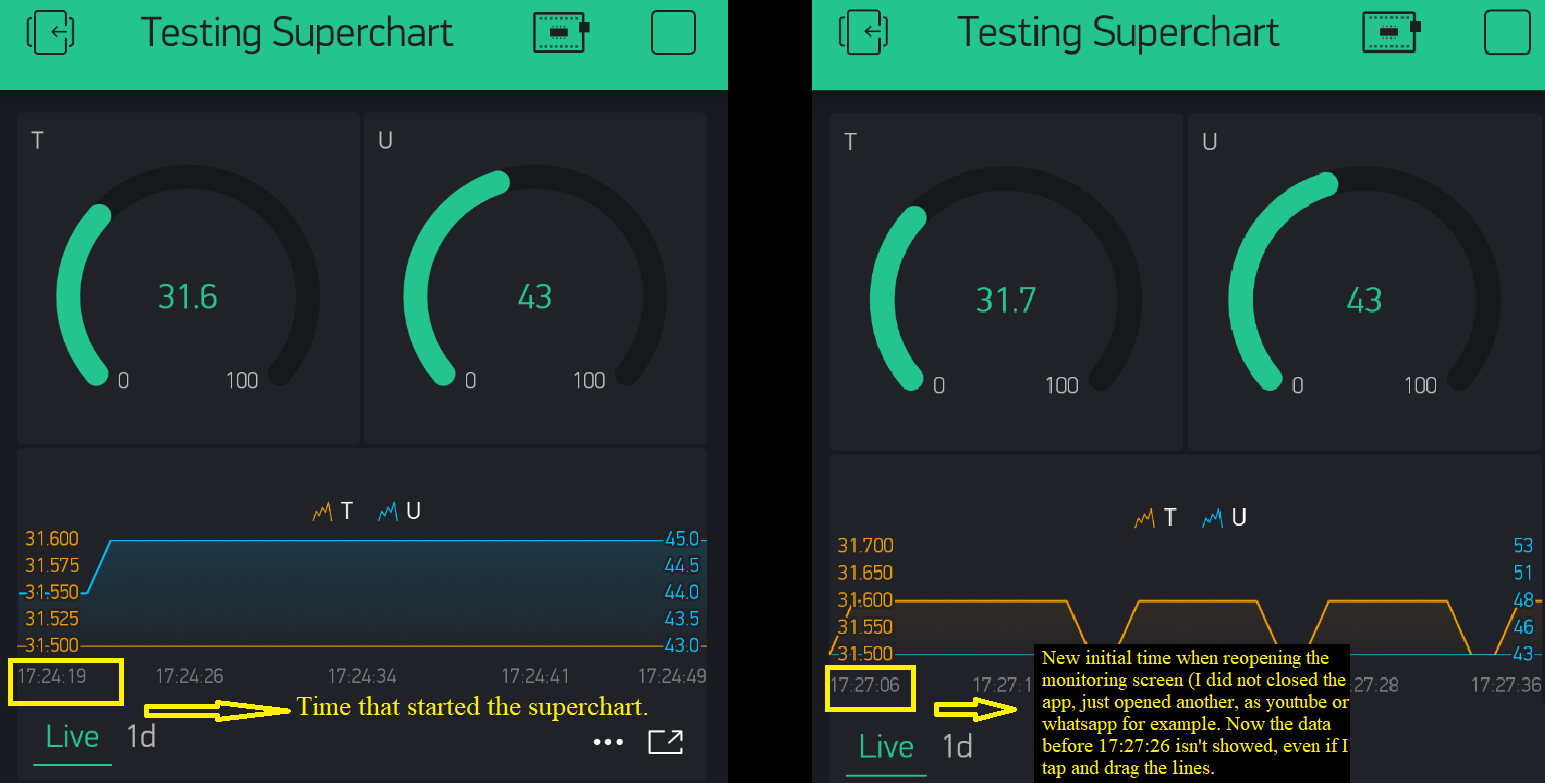
Hi. I am using an DHT 11 with ESP8266 and Blynk. I am having this problem: I added an superchart and it worked ok, but if I open other app on my phone, when back to blynk the superchart restarts the counting and I can’t visualize the historical measurements. For example: I am monitoring the superchart and needs to answer a conversation on whatsapp, when I reopen the blynk, the graphs show the data initiating at the time that I reopened the Blynk App, as I ilustrate on the image.
So, if I wish to export an csv file for, as example, 1 hour of measurements, I can’t open other app for 1 hour? The Blynk app needs to be in first plane to save all historical superchart? Thank you.
My hardware is an Android mobile phone, an ESP8266 and an DHT11 sensor. I am using the Blynk Server.
The code:
#include <ESP8266WiFi.h>
#include <BlynkSimpleEsp8266.h>
#include <DHT.h>

char auth[] = "xxxxxxxxxxxxxxxxxxxxxxxxxxxxxxxxx";

char ssid[] = "MyNet";
char pass[] = "password123";

#define DHTPIN 5

#define DHTTYPE DHT11

DHT dht(DHTPIN, DHTTYPE);
BlynkTimer timer;

void sendSensor()
{
  float h = dht.readHumidity();
  float t = dht.readTemperature(); //

  if (isnan(h) || isnan(t)) {
    Serial.println("Failed to read from DHT sensor!");
    return;
  }
  Blynk.virtualWrite(V5, t);
  Blynk.virtualWrite(V6, h);
}

void setup()
{
  Serial.begin(9600);

  Blynk.begin(auth, ssid, pass);

  dht.begin();
  timer.setInterval(1000L, sendSensor);
}

void loop()
{
  Blynk.run();
  timer.run();
}