Hi
I have 2 values X and Y. Which i need to send to Blynk via ESP. How can send these values and display it on blynk Graph?
Any way?
Hi
I have 2 values X and Y. Which i need to send to Blynk via ESP. How can send these values and display it on blynk Graph?
Any way?
I don’t understand how to use it.
I have values Time and Distance which are coming from serial port to esp. I want to read those values and display on graph in blynk app.
Which graph to use? Any sketch will be useful?
You need to Blynk.virtualWrite(V1, value); and on UI add history graph, ans select V1.
Thanks!
what is the significance of this command map(A0, 0, 4095, 0, 18.65); ??
It takes a range of numbers, in this case 0-4095 and converts it to a value between 0-18.65
It’s a sort of variable convertor.
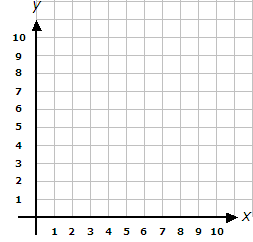
@Dmitriy @vshymanskyy @Pavel @marcofusco I tired above method but it doesn’t solve my problem. I have two values lets say X and Y, I need single graph to display both as shown in image. For example X=10 and Y=10, graph should show straight line. Right now I can send only value to Y and X remains time constant, i can alter it’s value.

It’s not that type of graph. It can only plot values against time, not against your own set of variables.
So, is there no other way to do this?
Probably not, but I’m not sure. Maybe @Dmitriy has a solution, but I think this is a limitation of the History widget, which is aptly named, because it’s not a Graph widget actually.
You can upload it to the cloud. I think it’s called thingspeak or something. Maybe that is a viable solution for you?
What is the point of using Blynk if I have to use Thing speak or Mqtt cloud for that purpose. May be this is the limitation of Graph.
That it is. Blynk is maturing as it develops. You can add this idea to the idea list and they will take a look at it.
Personally I’d vote for a custom graph widget, because I could use it too, but for now, it’s just not there.
Surely I will do. Cheers!
Yeap, that is good idea. Someday we will do that  at the moment this is not possible.
It looks like after a year, this is still not possible.
Yeap. The graph designed for time events (telemetry) and not for the custom points. Actually, this could be easily done, but this is only topic where this request was raised. So seem to me like low interest.
This opens up a huge range new possibilities for Blynk to be used for instrument control and data collection/plotting. If this can be easily done, please implement it and I will use it and show it on my blog. (www.TheSignalPath.com)
I am VERY interested in this kind of graph or similar.
I want to build a RADAR with a servomotor and ultrasound sensor. Therefore, i need tho plot “freely” X and Y values in a graph.
Hi,
I am very interested, too. I work as a science teacher and want to use it for many graphs, for example force-lenght, pressiere-height and many more.
Would be great!
Best regards, Benjamin
although it is not very clear what is needed until the end