Easiest way to export CSV and view in Excel

Hi, I’m using a superchart widget to collect data (via Blynk server) from a CO2 sensor, and I’d like to export historical data to excel so I can perform some basic analysis. From what I read about CSV in the blynk community, do I must use the local server in order to open the file? I tried to email the CSV file to my PC. When opened with Excel, what I only saw was random characters.

Thanks!

The files are compressed in .gz format. When you’ve “unzipped” the file you can open it in Excel.
You’ll then see the pin value and the time (in UNIX time format) in separate columns.

It’s fairly easy to convert the time to normal time format using Excel.

Pete.

Only to supplement information given by @PeteKnight: no, it perfectly works with cloud service provided by Blynk Team. And unpacking can be easily scripted to “automate” (at least partly) the process.

Thanks, I can see that now. The CSV data appears to be showing an average value of the data in an interval of one minute. Is it possible to configure the CSV data such that it records the value and timestamp of whenever a relative maximum value is reached?
By the way, does the third column of zeros mean anything?
blynk

The documentation here:
http://docs.blynk.cc/#widgets-displays-superchart

says “As Blynk Cloud is free to use we have a limit on how many data you can store. At the moment Blynk Cloud accepts 1 message per minute per pin. In case you send your data more frequently your values will be averaged. For example, in case you send value 10 at 12:12:05 and than again 12 at 12:12:45 as result in chart you’ll see value 11 for 12:12

I don’t know what the 3rd column means.

Pete.

image isn’t a correct UNIX Epoch time :wink:

Should look something like 1521674584 for Wednesday 21 March 2018 kl. 23:23:04 GMT

I think the n … E+12 occurs the column isn’t the correct type in Excel and/or not wide enough to display all numerals. Try format the cells to… Numbers?! (my menus are in Swedish :slight_smile: )

EDIT: Had to try for myself… Changed the cell formatting in column B to Numbers (no decimals). Deleted all values in C and used a fairly easy function as @PeteKnight calls it :stuck_out_tongue: to do the conversions. The cells in C should be formatted as Date, and Date Type as you prefer. Time also works. No highlighting is basic formatting, orange is different Date Type and yellow different Time Type

A straight translation of DATUMVÄRDE is DATE VALUE, but if it’s called that on English Excel I don’t know.

=(((B1/1000)-(7*3600))/86400)+(DATUMVÄRDE("1970-01-01") - DATUMVÄRDE("1900-01-01"))

1 Like

Well, It’s fairly easy when someone has done it before you and you just google the answer, which is what I did :stuck_out_tongue_winking_eye:

In English the formula would be:

=(((A1/1000)-(7*3600))/86400)+(DATEVALUE("1970-01-01") - DATEVALUE("1900-01-01"))

To display the converted time in a more readable format you can choose Custom formatting and adjust the way that you want the data to appear:

image

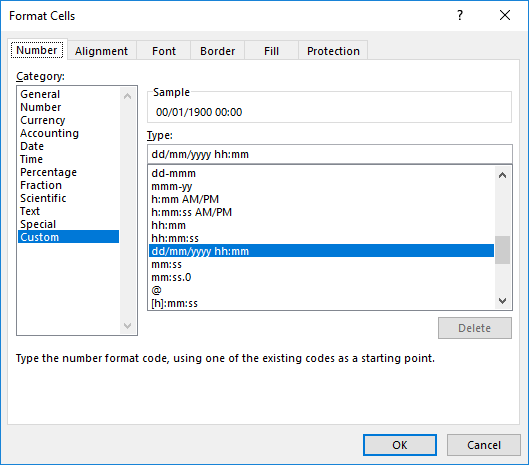
If you go for dd/mm/yyyy hh:mm then it’s easier to read (unless you’re American and insist on totally messing-up the way that dates are written). Going for Year Month Date as @Distans has done means that you can sort the dates into chronological order much more easily.

Edited to add…
The UNIX times in CSV exports are in GMT/UTC timezone format. The formula above contains a calculation which deducts 7 hours from this to convert it to MST/PDT.

If you’re in Europe then you’ll need to add one hour (in winter) or 2 hours (in summer) so the formula for European SummerTime would be:

=(((A1/1000)+(2*3600))/86400)+(DATEVALUE("1970-01-01") - DATEVALUE("1900-01-01"))

Pete.

2 Likes

I’m a new user and very impressed with the superchart widget, which does exactly what I need (monitoring environmental parameters in an experimental solar dryer). However, the CSV download function doesn’t appear to be working for me. I get an e-mail with 4 links (one for each virtual pin). When I click on the links, a tab appears and immediately disappears. When I attempt to open the URL for the links, which is like this:
imagehttp://45.55.96.146/m…….@ucdavis.edu_973756963_0_v10_1530972438585.csv.gz
I get a message: This blynk-cloud.com page can’t be found.
I see the data fine on the app, and would really like to implement the download function. Any idea what I’m doing wrong?

@msreid0 hello. Please use “Reports” widget instead. Export from a graph is no longer supported and will be dropped soon.

The url above should work anyway. When did you generate those url? Maybe it is expired already?

Thanks… the report widget works, although on my system (MAC, Excel) I have to import the CSV file into Word, then copy and ‘paste special’ into Excel. Direct import into Excel (specifying comma delimiter) gives a single row of question marks in boxes. Don’t know if there’s a simple fix for that?

Did you unpack the file before import to excel?

Google doesn’t show me an ‘unpack’ function for .csv files. Just a lot of information on working with them in Python. If you can steer me in the right direction it would help me (and maybe others). Thanks

I mean initial file you download - it it a “.gz” file that is gzip archive.

simply use https://docs.google.com/spreadsheets and upload csv file to spreadsheets then just click on chart button

ErfanDL’s work around works fine. I can import into Google Docs, then paste those data into Excel for subsequent manipulation.

Dmitriy, the ‘reports’ widget generates a .csv file. The .csv report from the SuperChart widget is a csv.gz file.

How do I “unzip” this file?

Old topic… now we have the Reports Widget.

And as far as unzipping a file… use an unzip program :stuck_out_tongue_winking_eye: … WinZip, 7-Zip, whateverzip… Try Googling for them

1 Like