Hello gentlemen!
I started a monitoring project, with Blynk, for a week, but I have a problem with the graphics.
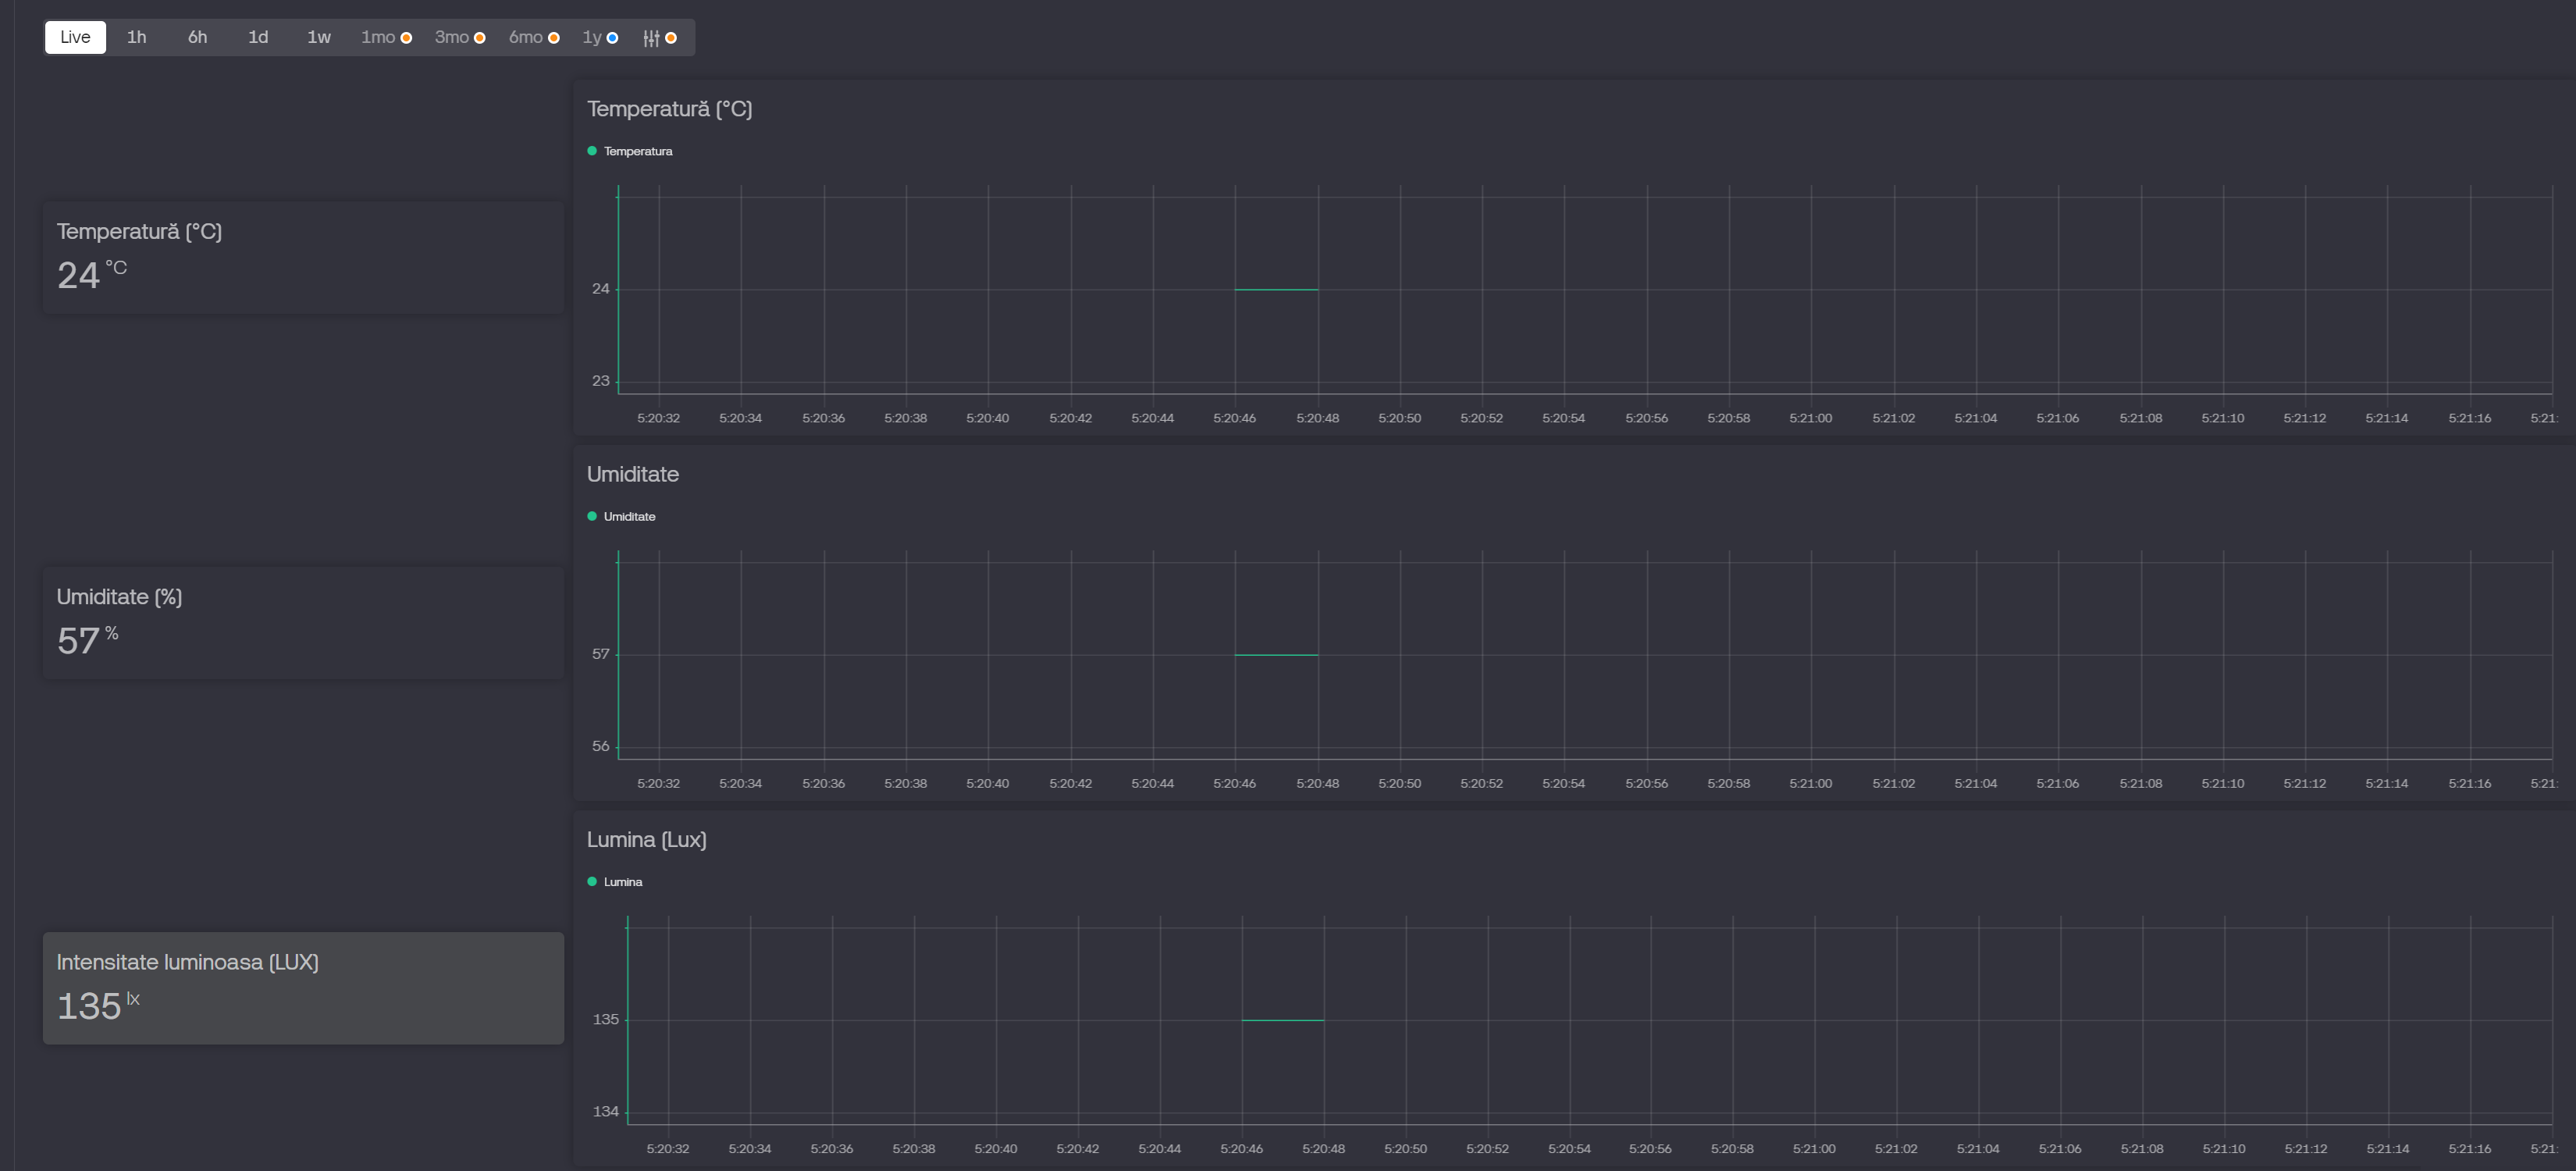
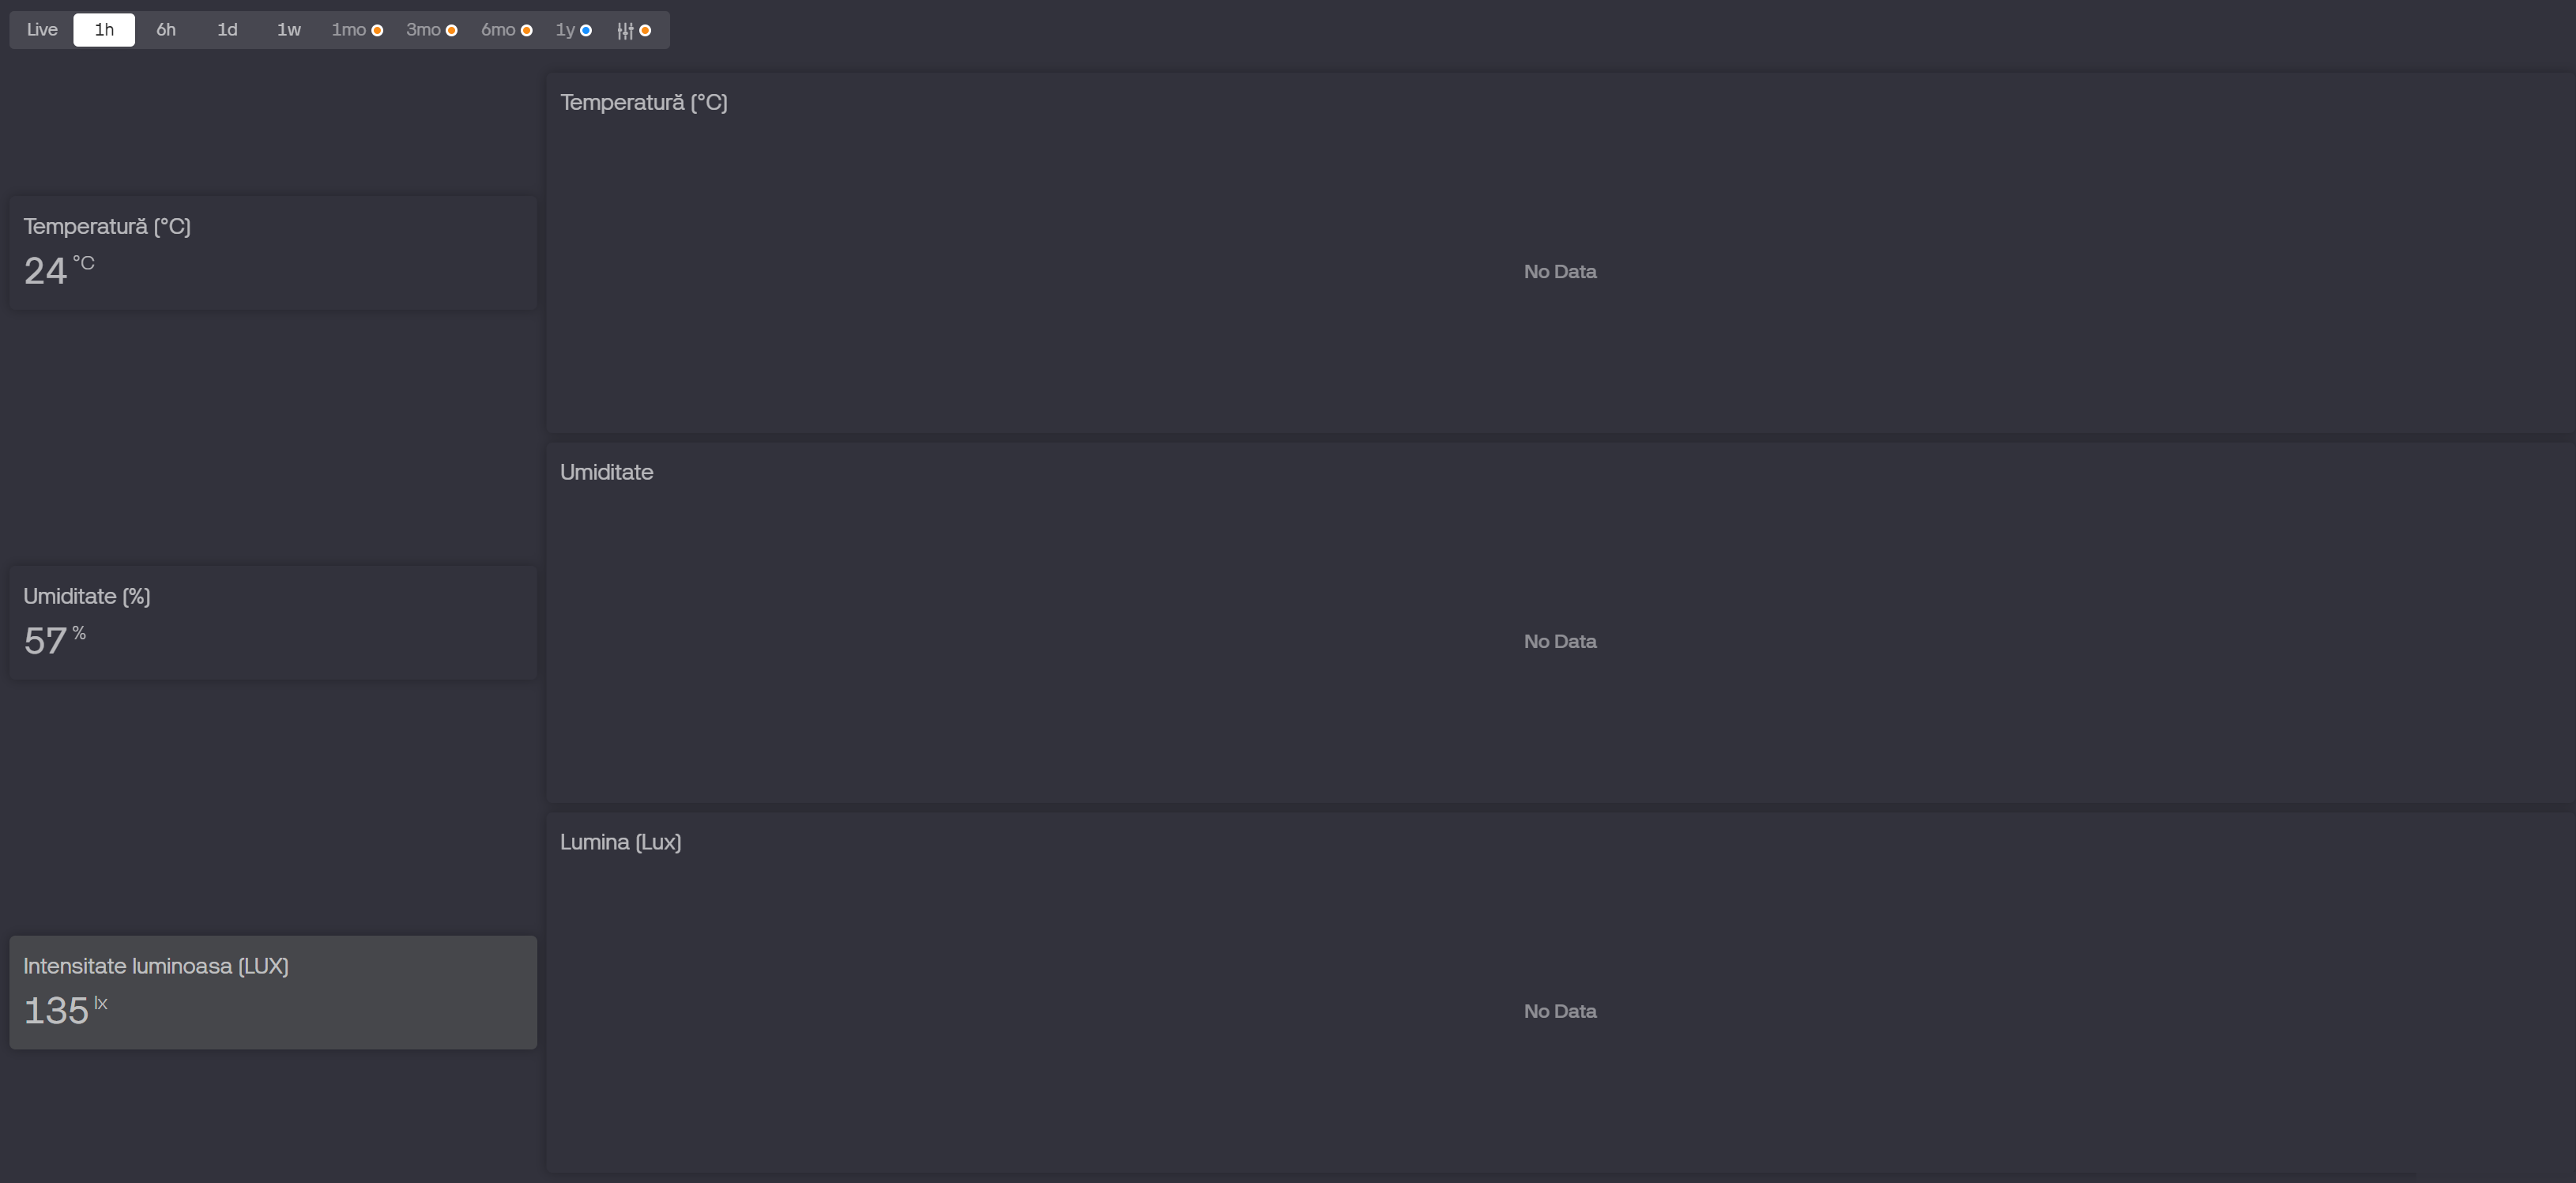
In the sense that it only displays my data if I’m on “Live”. On 1h, 6h, 6h, 1w, it doesn’t show me anything (No data).
And so, the data starts to appear only when I open the browser or the application, it doesn’t actually save anything.
Where could the problem be?
You need to turn on “Enable Data History” for each datastream you want to display in SuperChart.
Pete.
Oh God!
For several days I kept editing datastreams but I didn’t see that Enable history data.
Thank you very much!
1 Like
Thank you Pete, after I turned on “Enable Data History” for my datastreams, everything turned out perfect. Thank you for community.
1 Like